

Translate this page into:
Power of the test: A valuable biostatistical function to validate our research work
This article was originally published by Wolters Kluwer and was migrated to Scientific Scholar after the change of Publisher.
How to cite this article: Mittal R, Singh P, Patel S. Power of the test: A valuable biostatistical function to validate our research work. APOS Trends Orthod 2016;6:191-3.
Abstract
Any study involving a sample from population of interest may fail to detect the real significant difference in outcome between the groups being studied. The main reason for its failure may include a poorly designed study or a study that lacked power. This article will briefly summarize the concept of “power of study” which is necessary to validate clinical research work, wherein differences in outcome rates between the groups under a study are not very large.
Keywords
Biostatistics
power of test
validate research work

INTRODUCTION
For a researcher, formulation of a hypothesis is the first major step in heading toward his/her research methodology. Hypothesis is a formal question which a researcher intends to resolve by scientific methods that relates an independent variable to some dependent variables,[1] for example, does rate of orthodontic tooth movement (OTM) differ in adult and adolescent patients during different phases of orthodontic treatment? This hypothesis is capable of being objectively verified and tested.
To test a statistical hypothesis, we often consider null hypothesis and alternate hypothesis. A null hypothesis is an assertion about the value of a population parameter.[2] It is an assertion that we hold as true unless we have sufficient statistical evidence to conclude otherwise. If we are in a need to compare the rate of OTM in adolescent and adult patients, we will proceed on the assumption that there is no difference in the rate of OTM in two groups, then this assumption is termed as null hypothesis. The hypothesis that negates any kind of relationship that can exist between the two variables is known as null hypothesis (H0). As against this, we may think that the rate of OTM is higher in adolescent patients when compared with adult patients, then this hypothesis is known as alternate hypothesis (H1). Alternate hypothesis represents all other possibilities that can happen in any assumption other than null hypothesis, which one tries to disprove with his/her findings. There can be many alternate hypotheses, but only one null hypothesis can be proposed for any assumption. There are two types of errors that one can make during the testing of hypothesis. We may reject null hypothesis when it is true or we may accept null hypothesis when it is not true. The former is known as Type I error and the latter as Type II error [Table 1 and Figure 1].[3]
| Possible Hypothesis test outcome | ||
|---|---|---|
| Null hypothesis true | Null hypothesis false | |
| Type 1 error | No error | Reject null |
| False negative probability = α | Probability = 1-α | hypothesis |
| No error | Type II error | Fail to reject Null |
| Probability = 1- β | False positive probability = β | Hypothesis/Accept Null Hypothesis |
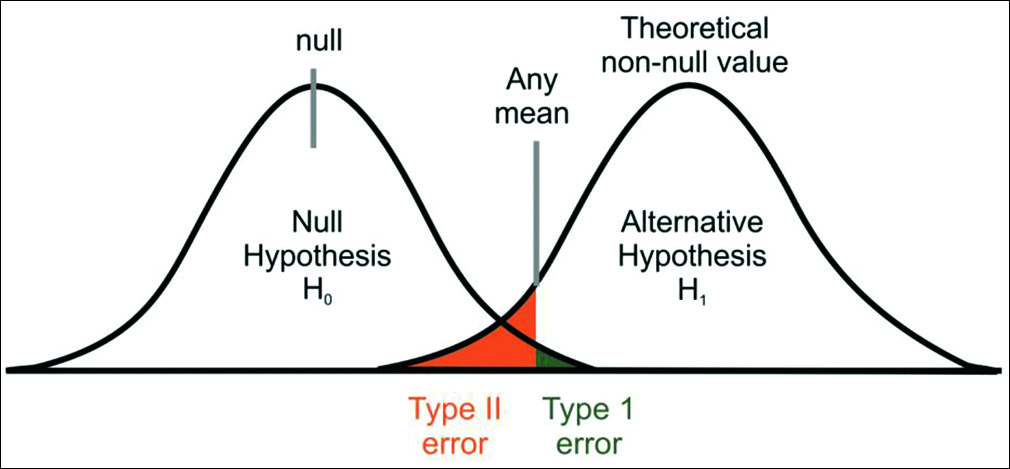
- Type I and Type II errors in a given population
The probability of Type I error is denoted by α and represents a level of significance. It should always be chosen with great care and reason. It is always expressed in some percentage (5%, 1%, or 0.01%) and is usually determined in advance before testing the hypothesis. We can control Type I error by fixing it at a lower level of significance, for example, fixing at 5% or 1% means maximum probability of committing Type I error would be 0.05 or 0.01. In simple words, it means that researcher is willing to take as much as a 5% or 1% risk of rejecting the null hypothesis when it happens to be true. Thus, the level of significance denotes the maximum probability of occurrence by chance and rejecting null hypothesis when it is true. But at the same time, when we try to reduce Type I error for a given sample size, the probability of committing Type II error increases.[3] Hence, both types of error cannot be reduced simultaneously. If we make α smaller (by accepting everything), we eventually increase β. Consider the case of setting α = 0. Although this may appear good because it reduces the probability of Type I error to zero, this corresponds to the foolish case as it will never reject H0. Hence, the probability of Type II error will increase to one.
Let us take an example:
Null hypothesis: Less than 90 g of orthodontic force is not sufficient for active retraction of canine.
Type I error: We reject null hypothesis (although it is true) and apply <90 g of force, but actually no tooth movement is happening (no effect on population).
Type II error: We accept null hypothesis (although it is false) and apply more forces, which will be more harmful (more harm on population).
Hence, Type II error is more harmful in this experimental study. In this case, we should strive to reduce the probability of Type II error more than that of Type I error.
In the intuitive approach, we try to estimate the relative harmful effect of the two types of errors. The relationship between Type I and Type II errors is not straightforward as it is based on different assumptions: There has to be no effect on population to make Type I error whereas to make Type II error, we have to miss some important effect on population.[2] If the effect of both is roughly equal or if we have not much knowledge about the relative harmful effect of the two types of errors, then we keep at 5%.
THE POWER OF THE TEST
The power (π) of a test refers to the probability of not committing a Type II (1-β) error[4] [Table 1]. It is the probability of detecting a “true effect,” when the effect exists. A good hypothesis test rejects a null hypothesis when it is false. Having a high value for 1-β (near 1.0) means it is a good test and having a low value (near 0.0) means it is a bad test (it is not rejecting null hypothesis when it is false). Hence, 1-β is a measure of how good a test is and it is known as the power of the test.
The power of the test is the probability that the test will reject H0 when in fact it is false. Conventionally, a test with a power of 0.8 is considered good as a standard for adequacy. This convention implies a four-to-one tradeoff between β-risk and α-risk (β is the probability of a Type II error; α is the probability of a Type I error, 0.2 and 0.05 are conventional values for β and α, respectively). In medicine, for example, tests are often designed in such a way that no false negatives (Type II errors) will be produced. However, this inevitably raises the risk of obtaining a false positive (a Type I error). The rationale is that it is better to tell a healthy patient, “we may have found something - let us test further,” than to tell a diseased patient, “all is well.”[2]
FACTORS THAT AFFECT THE POWER OF A TEST
The power of a hypothesis test is affected by three factors:
Sample size (n) - greater the sample size (keeping other parameters constant), the greater the power of the test
The “true” value of the parameter being tested - the greater the difference between the “true” value of a parameter and the value specified in the null hypothesis, the greater the power of the test. That is, the greater the effect size, the greater the power of the test
Significance level (α) - the higher the significance level, the higher the power of the test. High power will less likely accept the null hypothesis when it is false, i.e., less likely will make a Type II error.
If we plot the values of 1-β for each possible value of the population parameter for which null hypothesis is not true, the resulting curve is known as power curve associated with the given test. Perhaps, the most common use of power analysis is to determine the necessary number of subjects needed to detect an effect of a given size.
CONCLUSION
A power analysis is an effective measure to ensure that a good biostatistical study design has been planned and validated the research.
Before going on to advanced statistical procedure, studies must be adequately powered to achieve their aims, and appropriate sample size calculations should be carried out at the design stage of any study.
Financial support and sponsorship
Nil.
Conflicts of interest
There are no conflicts of interest.
References
- Complete Business Statistics. Homewood, IL: Irwin; 1989.
- Discovering Statistics Using SPSS for Windows: Advanced Techniques for Beginners (2nd ed). London: Sage; 2004.
- Research Methodology Methods & Techniques (2nd Revised Edition). New Delhi: New Age International (P) Ltd.; 2004.
- The Essential Guide to Effect Sizes: An Introduction to Statistical Power, Meta-Analysis and the Interpretation of Research Results. United Kingdom: Cambridge University Press; 2010.


