

Translate this page into:
Physical and chemical changes of clear aligners after thermoforming and intraoral exposure


-
Received: ,
Accepted: ,
How to cite this article: Dalaie K, Talebi Rafsanjan K, Nojehdehian H, Namazi Z. Physical and chemical changes of clear aligners after thermoforming and intraoral exposure. APOS Trends Orthod. doi: 10.25259/APOS_169_2023
Abstract
Objectives:
This study assessed the physical and chemical changes of clear aligners after thermoforming and intraoral exposure.
Material and Methods:
This ex vivo study evaluated raw sheets, thermoformed sheets, and aligners used for 2 weeks from two commercial brands of Erkodur and Shinseki (n = 8 in each group). The surface hardness (by the Vickers hardness test), thickness (by a digital caliper), and glass transition temperature (Tg) (by differential scanning calorimetry) of the specimens were measured, and they underwent X-ray diffraction (XRD) to assess their degree of crystallinity and attenuated total reflectance-Fourier-transform infrared spectroscopy (ATR-FTIR) for analysis of their molecular composition. Data were analyzed by one-sample, paired and independent t-tests, and Mann–Whitney U and Wilcoxon signed-rank tests (alpha = 0.05).
Results:
The XRD and ATR-FTIR spectra of Erkodur and Shinseki aligners matched those of polyethylene terephthalate glycol polymer and did not change after thermoforming or intraoral exposure. Unlike intraoral exposure (P > 0.05), thermoforming significantly decreased the hardness of both brands of aligners (P < 0.05). Intraoral exposure significantly decreased the thickness of Erkodur aligners at some points and significantly increased the thickness of Shinseki aligners (P < 0.05). Thermoforming significantly decreased the Tg of both brands of aligners (P < 0.05). Intraoral exposure significantly decreased the Tg of Erkodur and increased the Tg of Shinseki aligners (P = 0.000).
Conclusion:
Erkodur and Shinseki aligners showed high chemical and structural stability after thermoforming and 2 weeks of intraoral exposure. However, thermoforming affected the thermal and physical properties of both brands of aligners. Erkodur aligners had higher dimensional stability than Shinseki aligners.
Keywords
Clear aligner appliances
Hardness
X-Ray diffraction
Spectroscopy
Fourier transform infrared
Glass transition
Thermoforming

INTRODUCTION
With the growing number of adult patients seeking orthodontic treatment, the demand for more esthetic orthodontic appliances is also on the rise.[1] Clear aligners were introduced in response to this growing demand, and due to their acceptable treatment results, they have been well accepted as an alternative to fixed orthodontic appliances for the treatment of mild-to-moderate malocclusions.[2] Clear aligners have advantages such as easier oral hygiene practice, preservation of periodontal health, lower incidence of root resorption, and resolution of pains related to temporomandibular disorders.[3-5] Noticeable advances in designing and application of attachments, the possibility of using skeletal anchorage, and the application of specific biomaterials in the composition of aligners have all improved the performance of aligners, enabling the fixing of a wider range of malocclusions with clear aligners.[2,6,7]
Despite numerous advances in treatment with aligners, they still have limitations in achieving some dental movements such as extrusion, correction of severe rotations, uprighting of molar teeth, tooth extraction space closure, and torque application.[1,8] A systematic review by Rossini et al.[9] demonstrated that the most difficult dental movement to achieve by aligners was extrusion with 30% accuracy, while distalization of maxillary molars was the most predictable movement with 88% accuracy. Leveling and alignment of teeth are also easily performed using aligners.[9] Recent studies revealed that clear aligners have poor performance in the correction of anteroposterior discrepancies and achieving optimal occlusal contacts.[1,10,11]
Several reasons have been proposed for the lower-than-expected efficacy of clear aligners for orthodontic tooth movement compared with fixed appliances, including material properties, material thickness, manufacturing process, the accuracy of fit of aligners on the teeth and attachments, and changes in material properties following intraoral exposure.[12-14] At present, thermoplastic resin polymers such as polyester, co-polyester, polycarbonate, polyurethane, and polypropylene are used for the fabrication of aligners due to their optimal properties.[15] Resin polymers used for the fabrication of aligners have a regular crystalline structure in an amorphous background. The crystalline/amorphous structure ratio affects the mechanical and thermal properties of the aligners.[16] These materials enable the fabrication of aligners with optimal fit on dental casts through the thermoforming process. However, studies on aligners exposed to the oral environment or simulated conditions revealed changes in the original shape and structure of aligners following exposure. Thermal alterations, moisture, saliva enzymes, and elastic deformation can affect the properties and mechanical behavior of.[13,17,18] Increased stiffness has been particularly reported following intraoral exposure due to changes in the polymer crystalline structure of clear aligners.[19] Alterations in the structure and chemical functional groups of aligners can be studied by X-ray diffraction (XRD) and Fourier-transform infrared spectroscopy (FTIR).
The hardness of aligners can also affect their load application properties. Evidence shows that the hardness of polymer materials depends on their residual monomer and thickness.[20] The correlation between the thickness and hardness of aligners indicates the significance of their geometric properties, such as shape, thickness, and dimensions, in clinical practice. For instance, occlusal surface wear of aligners affects the duration and magnitude of load they apply to the teeth.[2]
Other influential factors on the properties of aligners include their fabrication process and the heat applied during thermoforming for shaping and adaptation of aligners to the printed casts. Thermoforming is defined as the application of pressure and heat (a specific temperature for a certain period of time) on the aligner by the manufacturer. The significant role of thermoforming in the reduction of mechanical and thermal properties of aligners has been previously confirmed.[2,14,21] Dalaie et al.[10] demonstrated that thermoforming decreased the flexural modulus, hardness, and glass transition temperature (Tg) of clear aligners.
A correct understanding of the changes in the chemical and mechanical structure of the aligners following their thermoforming and intraoral exposure is imperative for precise treatment planning and achieving ideal results. However, the role of these parameters in the efficacy of aligners has not been adequately investigated. Furthermore, the interaction effect of the manufacturing process and intraoral exposure on the chemical and physical properties of aligners has not been previously evaluated. Thus, this study aimed to assess the physical and chemical changes of clear aligners after thermoforming and intraoral exposure.
MATERIAL AND METHODS
This ex vivo study was conducted on clear aligners from two commercial brands, Erkodur and Shinseki. Erkodur and Shinseki aligners underwent several tests in three steps: before thermoforming, after thermoforming, and 2 weeks after intraoral exposure. The two groups were compared at each step with respect to physical and chemical changes. The study protocol was approved by the Ethics Committee of Shahid Beheshti University of Medical Sciences (IR.SBMU. DRC.REC.1401.075).
Sample size
According to a study by Bucci et al.[2] the sample size was calculated to be 8 in each group, assuming alpha = 0.05, beta = 0.2, study power of 80%, and a mean difference and standard deviation of 0.03 and 0.04, respectively, between the two study groups. Accordingly, 16 patients were enrolled.
Eligibility criteria
The inclusion criteria were age over 18, complete dentition except for third molars, good oral hygiene, no periodontal disease, systemic health, 0-–4 mm crowding (measured on dental casts), non-extraction treatment, willingness to participate in the study, and signed informed consent forms.
The exclusion criteria were maxillofacial or temporomandibular joint pain, active carious lesions, and a history of previous orthodontic treatment.
Specimen preparation
Of each brand, two aligners were thermoformed on the dental molds of patients. One aligner was used for specimen preparation, and the respective tests, and the other one was delivered to patients. Dental molds of patients were printed by a 3D printer (Cubicon Style (HyVISION, Seoul, South-Korea) using photo-polymer acrylic resin and the fused deposition molding technology with 100 µm accuracy and printing speed of 1 cm/40–60 min. Each layer was cured with blue light at 405 nm wavelength. After curing, the molds were rinsed with alcohol to harden their surface. Erkodur and Shinseki sheets with 0.5 mm thickness were used for the fabrication of aligners.
The patients were instructed on how to clean and use the aligners and asked to wear them for 22 hours a day. They were also instructed to remove the aligners for eating and drinking (with special emphasis on removing them when drinking hot and colored drinks). The patients were visited after a 2-week period, and their used aligners were collected.
Thermoforming
For thermoforming of sheets, Erkodent Erkoform 3D Plus Vacuum Thermoforming Unit (Erkodent Erich Kopp GmbH, Pfalzgrafenweiler, Germany) was used. For this purpose, the sheets were subjected to 160°C infrared temperature for 30 s and were then cooled for 45 s.
Attenuated total reflectance (ATR)-FTIR
Specimens measuring 5 × 5 mm were cut out of the buccal surface of the maxillary right central incisor of the aligners and underwent ATR-FTIR (Nicolet iS10; Thermo Fisher, Waltham, MA, USA). The measurements were made at room temperature at 600–4000 cm-1 by 16 scans with a resolution of 4 cm-1. The absorbance and transmittance spectra were compared with the reference spectra.[12]
Surface hardness
Specimens measuring 5 × 5 mm underwent a hardness test in a Vickers hardness tester (Indentec, Zwick Roell, Genova, Italy). In each specimen, three indentations were created by the pyramidal-shaped diamond indenter by applying a 10 N load for 10 s. After indentation, the two diagonals of the indentation were measured under a light microscope at ×40 magnification, and the Vickers hardness number (VHN) was calculated as follows:
Where F is the applied load in Newtons (N), and d is the mean of the two diagonals of each indentation in millimeters (mm). The VHN was reported in megapascals.
Thickness
To measure the thickness of the aligners, the maxillary first molar and first premolar teeth were cut out of the aligners, and the following points were marked on the first molars: Mesiobuccal cusp tip (U6MB), distobuccal cusp tip (U6DB), gingival margin of the buccal surface along the buccal groove (U6BG), mesiopalatal cusp tip (U6MP), distopalatal cusp tip (U6DP), and gingival margin of the palatal surface along the palatal groove (U6PG). The following points were marked on premolar teeth: buccal cusp tip (U4B), gingival margin of the buccal surface along the buccal groove (U4BG), palatal cusp tip (U4P), and gingival margin of the palatal surface along the palatal groove (U4PG). The thickness at each point was measured by a digital caliper (Insize, Zamudia, Biscay, Spain) with 0.01 mm accuracy. All measured points were distant from attachment areas. The thickness at each point was measured in triplicate, and the mean of the three values was calculated and reported.
Differential scanning calorimetry (DSC)
DSC was carried out to determine the static Tg by DSC 214 Polyma® (Netzsch-Gerätebau GmbH, Germany). For this purpose, the specimens underwent −70–240°C temperature at a speed of 10°C/min.[13]
XRD
Specimens measuring 5 × 5 mm were cut out of the buccal surface of the maxillary left central incisor and transferred to a diffractometer (D8-Advance; Bruker, Germany) with Cu anode at Ka = 1.54 A° at room temperature. The XRD patterns were recorded at 2θ = 5–60°C with a 0.03°-degree step every 2 s.[12] The full width at half maximum (FWHM) was calculated using Upex software (Upex version 1.7, Tehran, Iran).
Statistical analysis
The normal distribution of data was analyzed by the Shapiro-Wilk test. Accordingly, one-sample, paired, and independent t-tests were applied to analyze normally distributed data, while the Mann–Whitney U and Wilcoxon signed-rank tests were applied to analyze non-normally distributed data. All statistical analyses were carried out using SPSS version 25 at a 0.05 level of significance.
RESULTS
ATR-FTIR
[Figures 1 and 2] present the transmission graphs of Shinseki and Erkodur aligners. A comparison of the spectra with the polyethylene terephthalate glycol (PETG) reference spectra revealed that both aligners were made of PETG.[12] The two aligner types showed similar peaks at all three steps. A comparison of raw aligner sheets before thermoforming with thermoformed aligners before and after intraoral exposure revealed no significant change in their chemical structure.
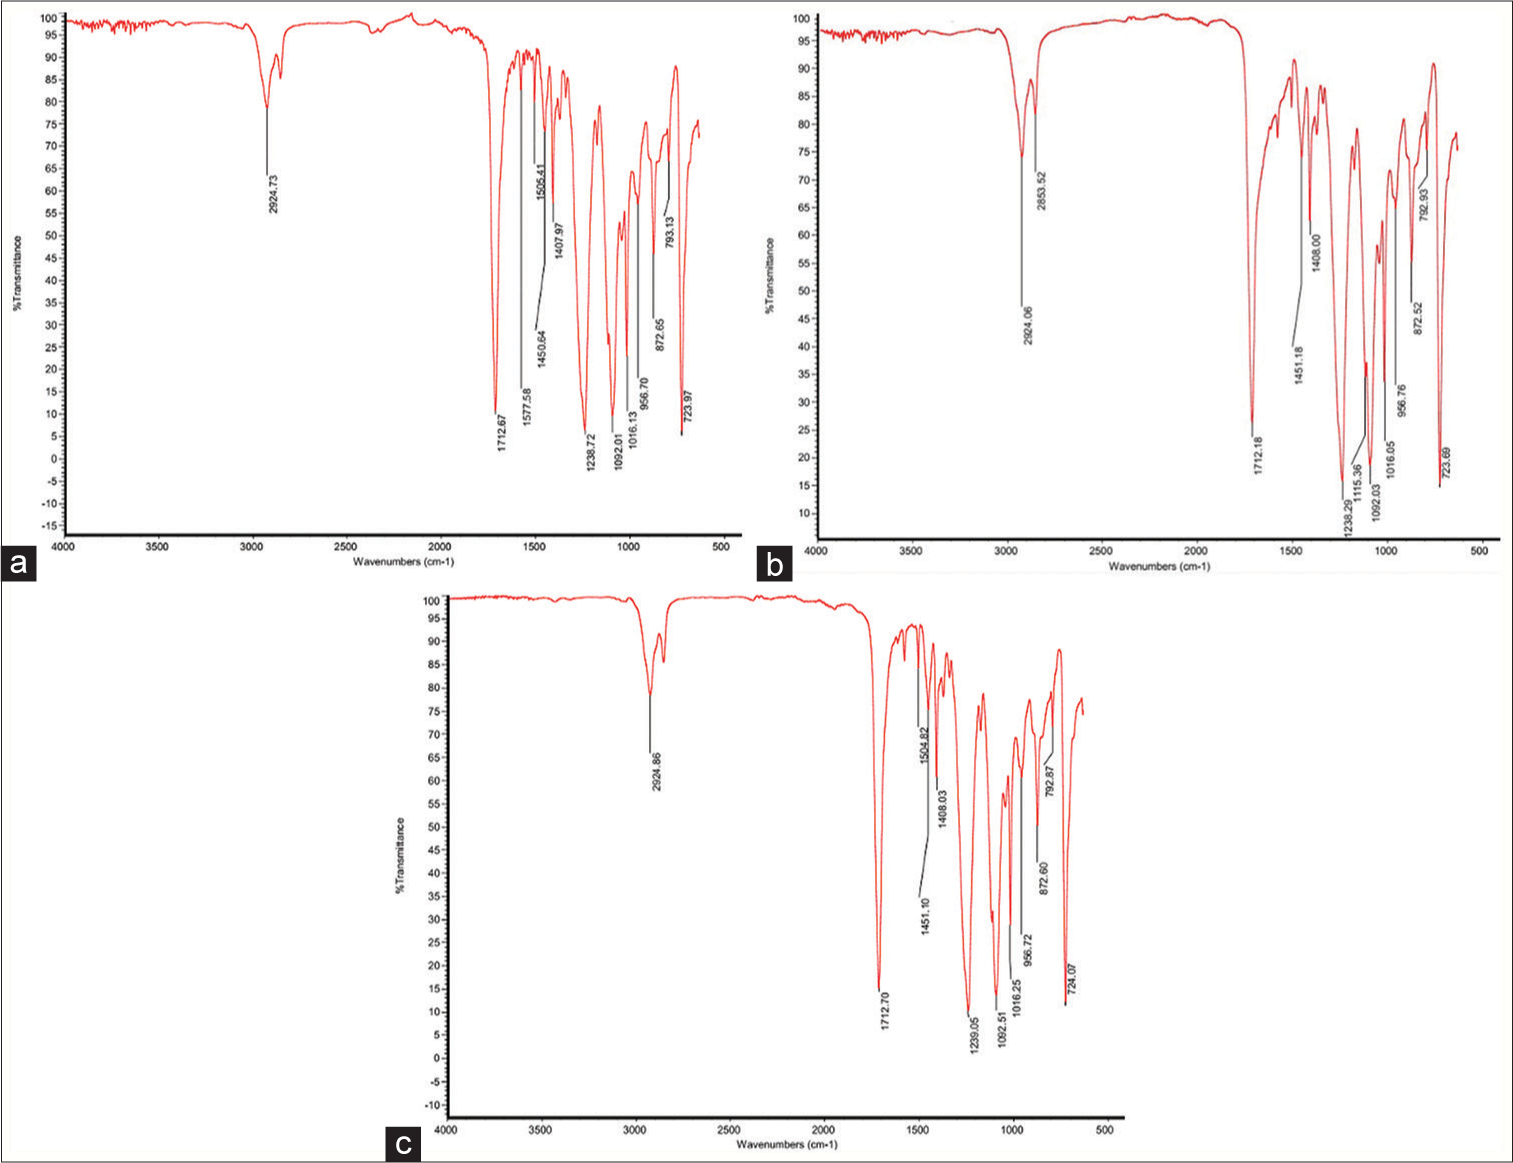
- Transmission graphs of Shinseki aligners. (a) Before thermoforming, (b) after thermoforming and before intraoral exposure, and (c) after intraoral exposure.

- Transmission graphs of Erkodur aligners. (a) Before thermoforming, (b) after thermoforming and before intraoral exposure, and (c) after intraoral exposure.
[Table 1] presents the identified functional groups in ATR-FTIR graphs.
| Peak wavelength (cm-1) | Functional group | Mode of vibration |
|---|---|---|
| 2923 | -C–H (CH3, CH2) | Stretching (asym/sym) |
| 1712 | -C=O (ester, acid) | Stretching |
| 1577 | C-O-C | Stretching |
| 1505 | =CH2 | Wagging |
| 1450 | -C–H (CH3 , CH2 ) | Bending |
| 1408 | -C–H (CH3) | Bending |
| 1239 | -C–O | Stretching |
| 1115 | -C–O | Stretching |
| 1092 | -C–O | Stretching |
| 1016 | -C–O | Stretching |
| 956 | -HC=CH-(trans/cis) | Bending (out of plane) |
| 872 | =CH2 | Wagging |
| 793 | -C–H (cis) | Bending (out of plane) |
| 724 | -C–H (cis) | Bending (out of plane) |
Surface hardness
One-sample t-test was applied to compare the surface hardness of raw sheets before thermoforming with the surface hardness of thermoformed aligners. The results showed a significant reduction in the surface hardness of both Erkodur (from 10.33 to 9.53, P = 0.002) and Shinseki (from 10.66 to 8.70, P = 0.000) aligners.
An independent t-test was applied to compare the surface hardness of the two groups of aligners before and after intraoral exposure [Table 2]. The results showed that the surface hardness of Erkodur aligners was significantly higher than that of Shinseki aligners before intraoral exposure (P = 0.035). However, the surface hardness of the two groups had no significant difference after intraoral exposure (P = 0.433). The change in surface hardness after intraoral use was not significantly different between the two groups either (P = 0.744).
| Brand | Mean | SD | SE | Statistic | P-value | |
|---|---|---|---|---|---|---|
| Before intraoral exposure | Shinseki | 8.7038 | 0.898 | 0.31749 | -2.332 | 0.035 |
| Erkodur | 9.5388 | 0.46841 | 0.16561 | |||
| After intraoral exposure | Shinseki | 9.5388 | 1.12732 | 0.39857 | -0.808 | 0.433 |
| Erkodur | 10.0813 | 1.52921 | 0.54066 | |||
| Hardness difference | Shinseki | 0.835 | 1.672944 | 0.591475 | 0.333 | 0.744 |
| Erkodur | 0.5425 | 1.841116 | 0.650933 |
SD: Standard deviation, SE: Standard error
The surface hardness of aligners in the two groups did not undergo significant changes after intraoral exposure (mean change of −0.54 ± 1.84 with P = 0.432 for Erkodur and mean change of −0.83 ± 1.67 with P = 0.201 for Shinseki).
Thickness
As shown in [Table 3], the following significant differences were found between the two groups of aligners in thickness:
| Variable | Brand | Mean | SD | SE | Statistic | P-value |
|---|---|---|---|---|---|---|
| U6RMB.B.thickness | S | 0.45600 | 0.018754 | 0.006631 | 0.309* | 0.762 |
| E | 0.45275 | 0.023144 | 0.008183 | |||
| U6RMB.A.thickness | S | 0.47300 | 0.025174 | 0.008900 | 7.500† | 0.008 |
| E | 0.44163 | 0.022136 | 0.007826 | |||
| U6RDB.B.thickness | S | 0.42975 | 0.030960 | 0.010946 | 23.500† | 0.396 |
| E | 0.44288 | 0.033808 | 0.011953 | |||
| U6RDB.A.thickness | S | 0.44875 | 0.036272 | 0.012824 | 0.517* | 0.613 |
| E | 0.44050 | 0.026854 | 0.009494 | |||
| U6RGB.B.thickness | S | 0.44125 | 0.023813 | 0.008419 | 2.038* | 0.061 |
| E | 0.38513 | 0.074151 | 0.026216 | |||
| U6RGB.A.thickness | S | 0.45525 | 0.029016 | 0.010259 | 2.642* | 0.019 |
| E | 0.37975 | 0.075432 | 0.026669 | |||
| U6RMP.B.thickness | S | 0.45338 | 0.039713 | 0.014041 | −0.252* | 0.805 |
| E | 0.45875 | 0.045465 | 0.016074 | |||
| U6RMP.A.thickness | S | 0.46550 | 0.034067 | 0.012045 | 1.231* | 0.239 |
| E | 0.44238 | 0.040802 | 0.014426 | |||
| U6RDP.B.thickness | S | 0.45300 | 0.010114 | 0.003576 | 1.817* | 0.091 |
| E | 0.44063 | 0.016396 | 0.005797 | |||
| U6RDP.A.thickness | S | 0.46788 | 0.012147 | 0.004295 | 1.500† | 0.000 |
| E | 0.43225 | 0.017119 | 0.006053 | |||
| U6RGP.B.thickness | S | 0.47050 | 0.041621 | 0.014715 | 4.387* | 0.001 |
| E | 0.38213 | 0.038915 | 0.013759 | |||
| U6RGP.A.thickness | S | 0.47350 | 0.029257 | 0.010344 | 4.686* | 0.000 |
| E | 0.37613 | 0.050969 | 0.018020 | |||
| U6LMB.B.thickness | S | 0.45475 | 0.032235 | 0.011397 | −0.107* | 0.917 |
| E | 0.45625 | 0.023328 | 0.008248 | |||
| U6LMB.A.thickness | S | 0.47675 | 0.029281 | 0.010352 | 1.793* | 0.095 |
| E | 0.45350 | 0.022084 | 0.007808 | |||
| U6LDB.B.thickness | S | 0.43638 | 0.028223 | 0.009978 | −1.167* | 0.263 |
| E | 0.45063 | 0.019928 | 0.007046 | |||
| U6LDB.A.thickness | S | 0.45013 | 0.028185 | 0.009965 | 0.487* | 0.634 |
| E | 0.44463 | 0.015052 | 0.005322 | |||
| U6LGB.B.thickness | S | 0.44600 | 0.037800 | 0.013364 | 3.007* | 0.009 |
| E | 0.39775 | 0.025110 | 0.008878 | |||
| U6LGB.A.thickness | S | 0.46013 | 0.038245 | 0.013522 | 4.011* | 0.001 |
| E | 0.39075 | 0.030499 | 0.010783 | |||
| U6LMP.B.thickness | S | 0.45088 | 0.033694 | 0.011913 | 0.443* | 0.665 |
| E | 0.44463 | 0.021454 | 0.007585 | |||
| U6LMP.A.thickness | S | 0.46138 | 0.033385 | 0.011803 | 1.737* | 0.104 |
| E | 0.43688 | 0.021853 | 0.007726 | |||
| U6LDP.B.thickness | S | 0.44800 | 0.017542 | 0.006202 | 16.000† | 0.097 |
| E | 0.43100 | 0.020220 | 0.007149 | |||
| U6LDP.A.thickness | S | 0.46138 | 0.021334 | 0.007543 | 3.182* | 0.007 |
| E | 0.42463 | 0.024732 | 0.008744 | |||
| U6LGP.B.thickness | S | 0.46775 | 0.019754 | 0.006984 | 4.915* | 0.000 |
| E | 0.38900 | 0.040789 | 0.014421 | |||
| U6LGP.A.thickness | S | 0.46850 | 0.032062 | 0.011336 | 3.897* | 0.002 |
| E | 0.38663 | 0.050028 | 0.017688 | |||
| U4RB.B.thickness | S | 0.43100 | 0.025813 | 0.009126 | 1.118* | 0.282 |
| E | 0.40975 | 0.047165 | 0.016675 | |||
| U4RB.A.thickness | S | 0.42725 | 0.028764 | 0.010170 | 1.013* | 0.318 |
| E | 0.41063 | 0.036410 | 0.012873 | |||
| U4RBG.B.thickness | S | 0.40975 | 0.034623 | 0.012241 | 1.223* | 0.242 |
| E | 0.38888 | 0.033656 | 0.011899 | |||
| U4RBG.A.thickness | S | 0.41888 | 0.032878 | 0.011624 | 2.892* | 0.012 |
| E | 0.36950 | 0.035367 | 0.012504 | |||
| U4RP.B.thickness | S | 0.39963 | 0.026387 | 0.009329 | 0.487* | 0.634 |
| E | 0.39300 | 0.027959 | 0.009885 | |||
| U4RP.A.thickness | S | 0.42413 | 0.023955 | 0.008469 | 3.107* | 0.008 |
| E | 0.38725 | 0.023517 | 0.008315 | |||
| U4RPG.B.thickness | S | 0.42700 | 0.030766 | 0.010878 | 0.486* | 0.635 |
| E | 0.41775 | 0.044184 | 0.015621 | |||
| U4RPG.A.thickness | S | 0.44800 | 0.035246 | 0.012461 | 1.556* | 0.142 |
| E | 0.41763 | 0.042517 | 0.015032 | |||
| U4LB.B.thickness | S | 0.43638 | 0.033882 | 0.011979 | 1.194* | 0.252 |
| E | 0.41313 | 0.043433 | 0.015356 | |||
| U4LB.A.thickness | S | 0.43125 | 0.038600 | 0.013647 | 1.199* | 0.250 |
| E | 0.40713 | 0.041831 | 0.014790 | |||
| U4LBG.B.thickness | S | 0.40863 | 0.017606 | 0.006225 | 0.784* | 0.446 |
| E | 0.39713 | 0.037582 | 0.013287 | |||
| U4LBG.A.thickness | S | 0.41750 | 0.025674 | 0.009077 | 2.665* | 0.018 |
| E | 0.37888 | 0.031957 | 0.011299 | |||
| U4LP.B.thickness | S | 0.43225 | 0.038306 | 0.013543 | 1.753* | 0.101 |
| E | 0.40225 | 0.029596 | 0.010464 | |||
| U4LP.A.thickness | S | 0.45250 | 0.035757 | 0.012642 | 3.476* | 0.004 |
| E | 0.39513 | 0.030021 | 0.010614 | |||
| U4LPG.B.thickness | S | 0.40988 | 0.035183 | 0.012439 | −0.651* | 0.525 |
| E | 0.42138 | 0.035424 | 0.012524 | |||
| U4LPG.A.thickness | S | 0.43575 | 0.032235 | 0.011397 | 20.500† | 0.242 |
| E | 0.41688 | 0.034564 | 0.012220 | |||
| U6RMB.diff | S | 0.0170 | 0.01585 | 0.00560 | 4.354* | 0.001 |
| E | −0.0111 | 0.00909 | 0.00322 | |||
| U6RDB.diff | S | 0.0190 | 0.00838 | 0.00296 | 8.000† | 0.010 |
| E | −0.0024 | 0.02054 | 0.00726 | |||
| U6RGB.diff | S | 0.0140 | 0.01482 | 0.00524 | 6.500† | 0.005 |
| E | −0.0054 | 0.01260 | 0.00446 | |||
| U6RMP.diff | S | 0.0121 | 0.01353 | 0.00478 | 3.487* | 0.004* |
| E | −0.0164 | 0.01875 | 0.00663 | |||
| U6RDP.diff | S | 0.0149 | 0.01644 | 0.00581 | 3.231* | 0.006 |
| E | −0.0084 | 0.01220 | 0.00431 | |||
| U6RGP.diff | S | 0.0030 | 0.02007 | 0.00710 | 1.013* | 0.328 |
| E | −0.0060 | 0.01513 | 0.00535 | |||
| U6LMB.diff | S | 0.0220 | 0.00877 | 0.00310 | 5.555* | 0.000 |
| E | −0.0028 | 0.00905 | 0.00320 | |||
| U6LDB.diff | S | 0.0138 | 0.00894 | 0.00316 | 4.498* | 0.001 |
| E | −0.0060 | 0.00862 | 0.00305 | |||
| U6LGB.diff | S | 0.0141 | 0.01254 | 0.00443 | 3.504* | 0.004 |
| E | −0.0070 | 0.01155 | 0.00408 | |||
| U6LMP.diff | S | 0.0105 | 0.00705 | 0.00249 | 1.500† | 0.000 |
| E | −0.0078 | 0.01094 | 0.00387 | |||
| U6LDP.diff | S | 0.0134 | 0.01115 | 0.00394 | 4.211* | 0.001 |
| E | −0.0064 | 0.00719 | 0.00254 | |||
| U6LGP.diff | S | 0.0008 | 0.01829 | 0.00647 | 0.326* | 0.749 |
| E | −0.0024 | 0.02003 | 0.00708 | |||
| U4RB.diff | S | −0.0038 | 0.01015 | 0.00359 | −0.643* | 0.530 |
| E | 0.0009 | 0.01762 | 0.00623 | |||
| U4RBG.diff | S | 0.0091 | 0.01599 | 0.00566 | 3.170* | 0.007 |
| E | −0.0194 | 0.01977 | 0.00699 | |||
| U4RP.diff | S | 0.0245 | 0.01226 | 0.00433 | 4.922* | 0.000 |
| E | −0.0058 | 0.01233 | 0.00436 | |||
| U4RPG.diff | S | 0.0210 | 0.00739 | 0.00261 | 3.752* | 0.002 |
| E | −0.0001 | 0.01411 | 0.00499 | |||
| U4LB.diff | S | −0.0051 | 0.02452 | 0.00867 | 0.079* | 0.938 |
| E | −0.0060 | 0.01949 | 0.00689 | |||
| U4LBG.diff | S | 0.0089 | 0.01975 | 0.00698 | 3.232* | 0.006 |
| E | −0.0183 | 0.01317 | 0.00466 | |||
| U4LP.diff | S | 0.0203 | 0.00506 | 0.00179 | 0.000† | 0.000 |
| E | −0.0071 | 0.01009 | 0.00357 | |||
| U4LPG.diff | S | 0.0259 | 0.01792 | 0.00634 | 4.500† | 0.002 |
| E | −0.0045 | 0.01922 | 0.00680 |
At U6RMB, U6RGB, U6RDP, U6LDP, U4RBG, U4RP, and U4LBG, the thickness was significantly greater in Shinseki aligners after intraoral exposure (P < 0.05). At U6RGP, U6LGB, and U6LGP, the thickness was significantly greater in Shinseki aligners both before and after intraoral exposure (P < 0.05). In the following points, a significant increase in thickness occurred in Shinseki aligners and a significant reduction in thickness occurred in Erkodur aligners after intraoral exposure: U6RMB, U6RGB, U6RMP, U6RDP, U6LMB, U6LDB, U6LGB, U6LMP, U6LDP, U4RBG, U4RP, U4LBG, U4RPG, U4LPG, and U4LP.
[Table 4] shows the changes in the thickness of aligners in the two groups after intraoral exposure compared with before at different points. As shown, a significant reduction in thickness was noted at U6RMB, U6RMP, U6LDP, U4RBG, and U4LBG in Erkodur aligners (P < 0.05). A significant increase in thickness was found at U6RMB, U6RDB, U6RGB, U6RGB, U6RDP, U6LMB, U6LDB, U6LGB, U6LMP, U6LDP, U4RP, U4RPG, U4LP, and U4LPG in Shinseki aligners (P < 0.05).
| Brand/Point | Erkodur | Shinseki | ||||||
|---|---|---|---|---|---|---|---|---|
| Mean | SD | Statistic | P-value | Mean | SD | Statistic | P-value | |
| U6RMB.B.thickness-U6RMB.A.thickness | 0.011125 | 0.009094 | 3.460* | 0.011 | −0.017000 | 0.015847 | −2.111† | 0.039 |
| U6RDB.B.thickness-U6RDB.A.thickness | 0.002375 | 0.020535 | 0.327* | 0.753 | −0.019000 | 0.008384 | −2.524† | 0.008 |
| U6RGB.B.thickness-U6RGB.A.thickness | 0.005375 | 0.012603 | 1.206* | 0.267 | −0.014000 | 0.014823 | −2.671* | 0.032 |
| U6RMP.B.thickness-U6RMP.A.thickness | 0.016375 | 0.018746 | 2.471* | 0.043 | −0.012125 | 0.013527 | −2.535* | 0.039 |
| U6RDP.B.thickness-U6RDP.A.thickness | 0.008375 | 0.012200 | 1.942* | 0.093 | −0.014875 | 0.016435 | −2.240† | 0.023 |
| U6RGP.B.thickness-U6RGP.A.thickness | 0.006000 | 0.015128 | 1.122* | 0.299 | −0.003000 | 0.020071 | −0.423* | 0.685 |
| U6LMB.B.thickness-U6LMB.A.thickness | 0.002750 | 0.009051 | 0.859* | 0.419 | −0.022000 | 0.008767 | −7.098* | 0.000 |
| U6LDB.B.thickness-U6LDB.A.thickness | 0.006000 | 0.008619 | 1.969* | 0.090 | −0.013750 | 0.008940 | −4.350* | 0.003 |
| U6LGB.B.thickness-U6LGB.A.thickness | 0.007000 | 0.011551 | 1.714* | 0.130 | −0.014125 | 0.012541 | −3.186* | 0.015 |
| U6LMP.B.thickness-U6LMP.A.thickness | 0.007750 | 0.010938 | 2.004* | 0.085 | −0.010500 | 0.007051 | −4.212* | 0.004 |
| U6LDP.B.thickness-U6LDP.A.thickness | 0.006375 | 0.007190 | 2.508* | 0.041 | −0.013375 | 0.011148 | −2.176† | 0.031 |
| U6LGP.B.thickness-U6LGP.A.thickness | 0.002375 | 0.020028 | 0.335* | 0.747 | −0.000750 | 0.018289 | −0.116* | 0.911 |
| U4RB.B.thickness-U4RB.A.thickness | −0.000875 | 0.017618 | −0.140* | 0.892 | 0.003750 | 0.010152 | 1.045* | 0.331 |
| U4RBG.B.thickness-U4RBG.A.thickness | 0.019375 | 0.019770 | 2.772* | 0.028 | −0.009125 | 0.015995 | −1.614* | 0.151 |
| U4RP.B.thickness-U4RP.A.thickness | 0.005750 | 0.012326 | 1.319* | 0.229 | −0.024500 | 0.012259 | −5.653* | 0.001 |
| U4RPG.B.thickness-U4RPG.A.thickness | 0.000125 | 0.014106 | 0.025* | 0.981 | −0.021000 | 0.007387 | −8.040* | 0.000 |
| U4LB.B.thickness-U4LB.A.thickness | 0.006000 | 0.019486 | 0.871* | 0.413 | 0.005125 | 0.024521 | 0.591* | 0.573 |
| U4LBG.B.thickness-U4LBG.A.thickness | 0.018250 | 0.013167 | 3.920* | 0.006 | −0.008875 | 0.019752 | −1.271* | 0.244 |
| U4LP.B.thickness-U4LP.A.thickness | 0.007125 | 0.010092 | 1.997* | 0.086 | −0.020250 | 0.005064 | −11.311* | 0.000 |
| U4LPG.B.thickness-U4LPG.A.thickness | 0.004500 | 0.019221 | −0.420† | 0.742 | −0.025875 | 0.017924 | −4.083* | 0.005 |
Tg
The mean Tg of both Erkodur (from 78.2 to 77.5, P = 0.016) and Shinseki (from 76.5 to 72.9, P = 0.000) aligners significantly decreased after thermoforming. As shown in [Table 5], the Tg of Erkodur aligners was significantly higher than that of Shinseki aligners before intraoral exposure (P = 0.000). However, the Tg of the two aligner groups were not significantly different after intraoral exposure (P = 0.201). Paired t-test showed that the Tg of Erkodur aligners significantly decreased (mean change of 2.17 ± 0.76, P = 0.000) while the Tg of Shinseki aligners significantly increased (mean change of 2.87 ± 1.16, P = 0.000) after intraoral exposure.
| Time | Brand | Mean | SD | SE | Statistic | P-value |
|---|---|---|---|---|---|---|
| Before intraoral exposure | Shinseki | 72.925 | 0.72457 | 0.25617 | −14.192 | 0 |
| Erkodur | 77.5625 | 0.57306 | 0.20261 | |||
| After intraoral exposure | Shinseki | 75.8 | 0.69076 | 0.24422 | 1.342 | 0.201 |
| Erkodur | 75.3875 | 0.52763 | 0.18655 |
SE: Standard error, SD: Standard deviation
XRD
[Figures 3 and 4] show the XRD patterns of Shinseki and Erkodur aligners. [Table 6] shows the FWHM of the two groups of aligners.
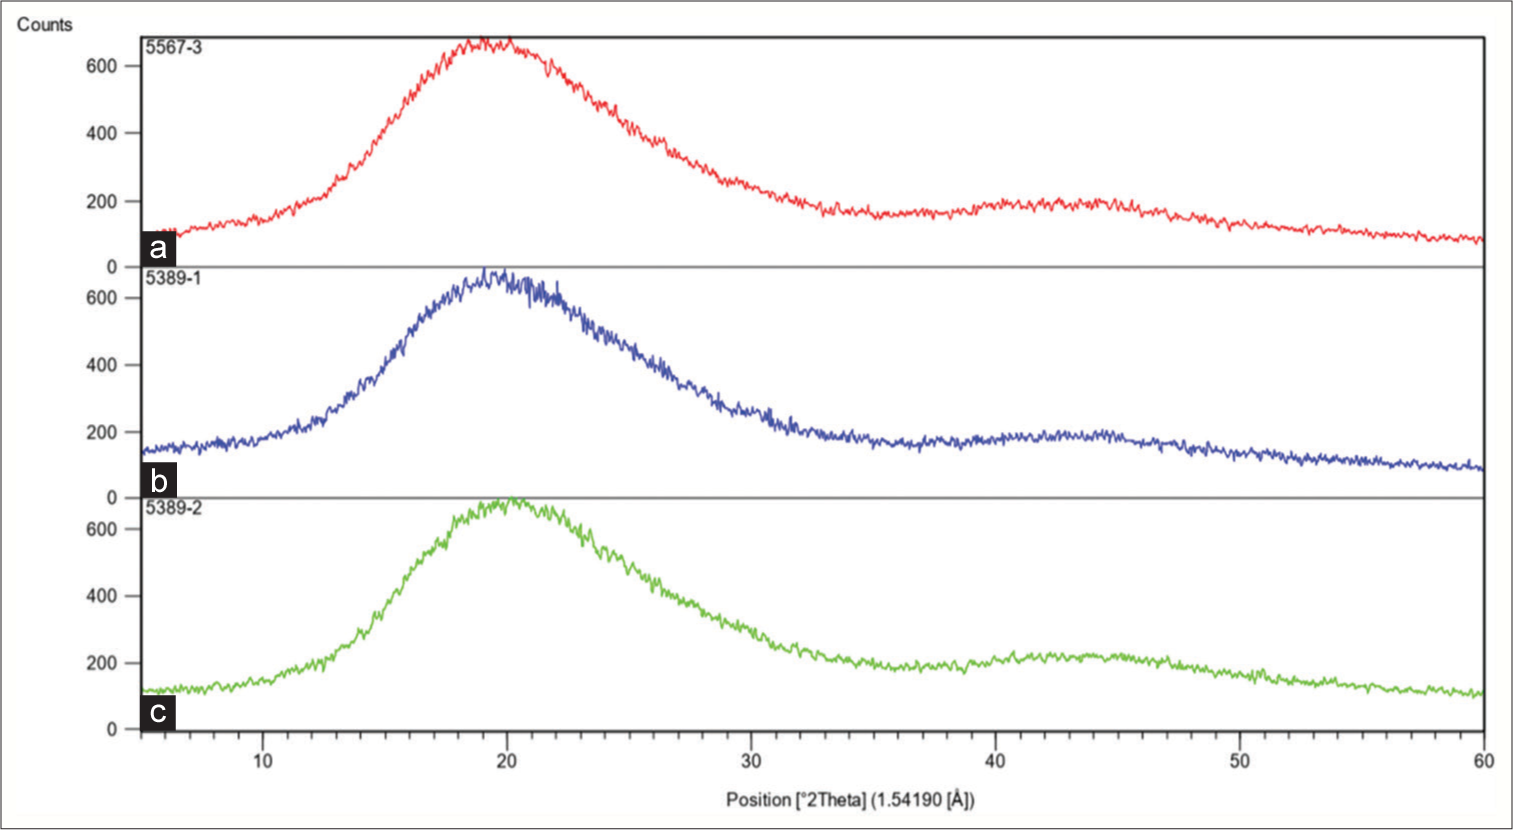
- X-ray diffraction pattern of Shinseki aligners (a) before thermoforming, (b) before intraoral exposure, and (c) after intraoral exposure.

- X-ray diffraction pattern of Erkodur aligners (a) before thermoforming, (b) before intraoral exposure, and (c) after intraoral exposure.
| Group/Aligner | After intraoral exposure | Before intraoral exposure | Raw sheet before thermoforming |
|---|---|---|---|
| Shinseki | 10.105 | 10.119 | 10.001 |
| Erkodur | 10.218 | 9.426 | 9.784 |
DISCUSSION
This study assessed the physical and chemical changes of clear aligners after thermoforming and intraoral exposure.
ATR-FTIR
The present results showed that the ATR-FTIR spectra of both Shinseki and Erkodur aligners matched those of PETG before thermoforming, and before and after intraoral exposure, with no significant difference between the two groups. Previous studies performed ATR-FTIR and reported that Invisalign (Align Technology, Inc. San Jose, CA, USA) and Zendura Flx (Zendura, Bay Materials LLC, Fremont, CA, USA) aligners are made of polyurethane while Essix ACE Plastic (Dentsply Sirona, York, PA, USA), Erkodur, and Ghost Aligner (BART MEDICAL S.r.l., Mezzano, Italy) are made of PETG.[4,12,14-16] However, no previous study was found on the material of Shinseki aligners. The above-mentioned studies evaluated the chemical composition of aligners after thermoforming, after intraoral exposure, or exposure to simulated intraoral environment. In the present study, raw sheets of aligners before thermoforming were evaluated and the results showed optimal chemical stability of PETG after thermoforming. A previous study introduced PETG as a material with high transparency, optimal flow, and favorable resistance against different solvents, which is suitable for different fabrication processes such as printing, die-cut, and hot-stamp.[17] The present results confirmed the optimal resistance of PETG against chemical changes following thermoforming and intraoral exposure.
Stability of aligner polymer material can be influenced by chemical groups on the material surface. The peak at 2923 cm-1 in ATR-FTIR spectra belongs to the C-H bond with stretching vibration, which is a hydrophobic group and can further stabilize the material by reduction of water sorption.[18] This peak was found in all ATR-FTIR spectra of the specimens in the present study and can explain their structural stability. Bradley et al.[14] found no significant change in chemical structure of reference aligners (before intraoral use) and retrieved aligners (after clinical use for 44 ± 15 days). Their results were in agreement with the present findings despite different assessment times. Gracco et al.[19] reported some molecular surface changes following intraoral use and immersion of Invisalign aligners in artificial saliva. However, gas chromatography-mass spectrometry confirmed their chemical stability. Memè et al.[16] reported no significant change in chemical properties of Invisalign aligners following exposure to tea, coffee, cola, and UV light for 24 and 48 h; however, tea and coffee pigments caused their significant color change. Despite the use of different types of aligners, their results regarding optimal chemical stability of aligners were in line with the present findings.
Surface hardness
The present results showed that thermoforming significantly decreased the VHN of both Shinseki and Erkodur aligners; however, intraoral exposure for 2 weeks did not significantly change their VHN. Hardness is defined as resistance against plastic deformation. Increased hardness of aligners not only affects their load application profile but can also cause patient discomfort during insertion and removal.[20] Kohda et al.[21] showed a strong correlation between the hardness of Duran, Erkodur, and Hardcast aligners and the applied load by them. Thus, change in hardness can be a good indicator of change in applied load and efficacy of aligners.
Dalaie et al.[10] reported a significant reduction in VHN of Duran and Erkodur aligners following thermoforming and aging, which was in agreement with the present results. However, aging by 200 thermal cycles following immersion in 37°C distilled water for 24 h significantly decreased the hardness of Erkodur aligners in their study, which was different from the present results that showed no significant change in hardness of aligners following their intraoral exposure. This difference can be due to different aging processes since their study had an in vitro design and aging was performed by thermocycling, while, in the present study, aligners were used by patients for 2 weeks. Bradley et al.[14] reported that intraoral aging of Invisalign aligners decreased their VHN and wear resistance, which was different from the present results since the hardness of the two groups of aligners did not significantly change after 2 weeks of intraoral exposure in the present study. This difference can be due to differences in aligner materials and different durations of use. Schuster et al.[22] indicated an increase in VHN of Invisalign aligners after intraoral use, probably due to cold work of mastication. Their results were in contrast to the present findings which may be attributed to the difference in aligner materials (polyurethane in their study versus PETG in the present study). Ryu et al.[23] evaluated the effect of thermoforming on the physical and mechanical properties of Duran, Essix A+, Essix ACE, and eCligner aligners and reported no change in Knoop hardness of Duran and eCligner and an increase in hardness of Essix A+ and Essix ACE; however, in the present study, the VHN of both aligners significantly decreased after thermoforming. This difference can be attributed to using different hardness tests and the fact that aging was not performed in their study. Furthermore, Iijima et al.[24] reported no significant reduction in hardness of Duran aligners after 500 thermal cycles. However, following 2500 thermal cycles, deterioration of hardness was found, which could be related to molecular or crystal structure of the aligner materials. Since 200 thermal cycles correspond to 2 weeks of clinical use,[10] their results were in line with the present findings.
Thickness
In the present study, Erkodur aligners did not show significant changes in thickness at most points following intraoral use. The thickness of Erkodur aligners significantly decreased at the mesiobuccal and mesiopalatal cusp tips of right first molar, distopalatal cusp tip of left first molar, and gingival margin of the buccal surface of first premolar. The thickness of Shinseki aligners increased after use at most points and this increase was significant at the mesiobuccal, distobuccal, mesiopalatal, and distopalatal cusp tips of first molar, gingival margin of buccal surface of first molar, and the palatal cusp tip and gingival margin of the palatal surface of first premolar. Thus, dimensional stability of Erkodur aligners was generally higher than that of Shinseki aligners. Kwon et al.[25] showed that thinner aligners exerted higher energy in deflection caused by optimal force application, and recommended the use of sheets with 0.5 mm thickness. Thus, sheets with 0.5 mm thickness were used in the present study. In contrast, Hahn et al.[26] reported an increase in applied load by an increase in thickness of aligners. It has been reported that thickness of aligners can affect their esthetics and transparency such that Lombardo et al.[27,28] indicated that F22 aligners had higher transparency than Invisalign and All-In aligners and also had lower thickness than other aligners after thermoforming. They concluded that lower thickness is associated with higher transparency. Bucci et al.,[2] in their study on thickness change of 18 PETG aligners following 10 days of intraoral use reported that the thickness significantly decreased only at the canine cusp tip in passive aligners (with no attachment design and no intention to cause tooth movement). Their results were in line with the present findings in Erkodur group. Reduction in thickness of aligners may be attributed to their possible wear[19,22] since they release no byproduct and the present ATR-FTIR spectra confirmed chemical stability of aligners following intraoral exposure for 2 weeks. Thickness reduction at the cervical margins can be due to repeated insertions and removals. Nonetheless, the reduction in Erkodur aligner thickness was <0.02 mm which does not appear to be clinically important (although it was statistically significant at some points). Shinseki aligners showed a significant increase in thickness at most points, which was <0.03 mm and does not appear to be clinically important although it was statistically significant. Increase in thickness may be due to water sorption and subsequent hygroscopic expansion, which can affect the adaptation of aligners and their load application properties. Biofilm formation on the aligner surface and subsequent calcification can be another reason for increased thickness.[19] ATR-FTIR spectra did not reveal any trace of calcified deposits, which may be due to the fact that buccal surface of anterior teeth of aligners was only selected for ATR-FTIR assessment. Possible deformation is another probable reason for change in thickness. Elastic deformation at the contact point of aligner and tooth is among the main mechanisms of load application by the aligners.[26] Occlusal forces can also cause deformation and dimensional changes of aligners and compromise their adaptation.[27]
Tg
Thermoforming significantly decreased the Tg in both aligner groups. Intraoral exposure caused a significant reduction in Tg of Erkodur and significant increase in Tg of Shinseki aligners. DSC results revealed only one peak at Tg, confirming the results of ATR-FTIR and XRD regarding the fact that aligners are made of amorphous thermoplastic materials. The Tg of pure PETG is approximately 80°C,[29] which was close to the values obtained in the present study. Iijima et al.[24] revealed that Tg affected the orthodontic force applied by aligners and can predict their efficacy. Unlike the present study, Wenger[30] reported no significant change in Tg of Invisalign, Simpli5, and ClearCorrect aligners following 2 weeks of use by using DSC analysis. Difference between their results and the present findings can be attributed to different composition of aligners. However, the Tg range in their study was close to that in the present study. Considering the phase transformation from glass to rubbery state at Tg and significant change in physical structure and properties of aligners, it is important to use materials with a Tg higher than the maximum expected temperature rise in the oral cavity to ensure no drop in properties after thermoforming and intraoral use of aligners. Despite changes in Tg of aligners in the present study, the Tg values were always higher than the maximum expected intraoral temperature rise following consumption of hot drinks (55–58°). The Tg values and their trend of change reported by Dalaie et al.[10] following thermoforming and thermocycling of Erkodur aligners were similar to the present findings.
XRD
In the present study, the XRD spectra of both aligners were the same before thermoforming and before and after intraoral use, and two peaks at 19 and 43 degrees were seen that matched the XRD spectra of PETG.[12] FWHM was calculated to quantify the results yielding a FWHM range from 9.426 for Erkodur aligners before intraoral exposure to 10.218 for Erkodur aligners after intraoral exposure. Daniele et al.[12] reported similar results for the peaks of Essix ACE Plastic, Ghost Aligner, and Invisalign made of PETG. FWHM values for PETG aligners ranged from 9.188 for Essix ACE Plastic to 11.315 for Erkodur aligners, which was close to the present findings. Hwang et al.[31] reported that by an increase in crystallinity, the transparency decreased and vice versa. Daniele et al.,[12] also showed that Erkodur aligners had the highest FWHM, lowest degree of crystallinity, and highest transparency. They added that calculation of FWHM can help predict the esthetic properties of aligners. Pazzini et al.[32] evaluated the XRD spectra of Invisalign aligners and found no significant change in their structure following intraoral use for 2 weeks, which was in agreement with the present results.
The present study had some limitations. Only the physical and chemical properties of aligners made of PETG were evaluated in the present study, and only sheets with 0.5 mm thickness was used. Furthermore, in this study, level of compliance of patients was assessed through patients’ self-report; however, we suggest the use of “compliance indicators” in future research as a more precise method. Future studies are required on aligners made of other materials such as polyurethane, PETG, and co-polyester with different sheet thicknesses. More accurate modalities such as microcomputed tomography can also be used to more precisely assess the change in thickness of aligners. Furthermore, microscopic assessment can reveal surface changes and possible causes of changed thickness.
CONCLUSION
Erkodur and Shinseki aligners showed high chemical and structural stability after thermoforming and 2 weeks of intraoral exposure. However, unlike intraoral exposure, thermoforming affected the thermal and physical properties of both aligner types. Erkodur aligners indicated higher dimensional stability than Shinseki aligners. The Tg of both aligner types showed significant changes after thermoforming and intraoral exposure but always remained higher than the maximum expected temperature rise in the oral cavity.
Ethics approval
The research/study approved by the Institutional Review Board at Shahid Beheshti University of Medical Sciences, number IR.SBMU.DRC.REC.1401.075, dated October 10, 2022.
Declaration of patient consent
The authors certify that they have obtained all appropriate patient consent.
Conflicts of interest
There are no conflicts of interest.
Use of artificial intelligence (AI)-assisted technology for manuscript preparation
The authors confirm that there was no use of artificial intelligence (AI)-assisted technology for assisting in the writing or editing of the manuscript and no images were manipulated using AI.
Financial support and sponsorship
This work was supported by the Deputy of Research, School of Dentistry, Shahid Beheshti University of Medical Sciences, Tehran, Iran.
References
- Orthodontic treatment with clear aligners and the scientific reality behind their marketing: A literature review. Turk J Orthod. 2019;32:241-6.
- [CrossRef] [PubMed] [Google Scholar]
- Thickness of orthodontic clear aligners after thermoforming and after 10 days of intraoral exposure: A prospective clinical study. Prog Orthod. 2019;20:36.
- [CrossRef] [PubMed] [Google Scholar]
- Functional magnetic resonance connectivity in patients with temporomadibular joint disorders. Front Neurol. 2021;12:629211.
- [CrossRef] [Google Scholar]
- Prevalence and severity of apical root resorption during orthodontic treatment with clear aligners and fixed appliances: A cone beam computed tomography study. Prog Orthod. 2020;21:1.
- [CrossRef] [PubMed] [Google Scholar]
- The periodontal status of removable appliances vs fixed appliances: A comparative meta-analysis. Medicine (Baltimore). 2020;99:e23165.
- [CrossRef] [PubMed] [Google Scholar]
- Effects of variable attachment shapes and aligner material on aligner retention. Angle Orthod. 2015;85:934-40.
- [CrossRef] [PubMed] [Google Scholar]
- Segmental multiple-jaw surgery without orthodontia: Clear aligners alone. Plast Reconstr Surg. 2018;142:181-4.
- [CrossRef] [Google Scholar]
- Mechanical and Geometrical properties assessment of thermoplastic materials for biomedical application In: Advances on Mechanics. Design Engineering and Manufacturing. Germany: Springer; 2017. p. :437-46.
- [CrossRef] [Google Scholar]
- Efficacy of clear aligners in controlling orthodontic tooth movement: A systematic review. Angle Orthod. 2015;85:881-9.
- [CrossRef] [Google Scholar]
- Dynamic mechanical and thermal properties of clear aligners after thermoforming and aging. Prog Orthod. 2021;22:15.
- [CrossRef] [Google Scholar]
- Effectiveness of clear aligner therapy for orthodontic treatment: A systematic review. Orthod Craniofac Res. 2020;23:133-42.
- [CrossRef] [Google Scholar]
- Color stability, chemico-physical and optical features of the most common PETG and PU based orthodontic aligners for clear aligner therapy. Polymers. 2022;14:14.
- [CrossRef] [PubMed] [Google Scholar]
- Thermoplastic disks used for commercial orthodontic aligners: Complete physicochemical and mechanical characterization. Materials (Basel, Switzerland). 2020;13:2386.
- [CrossRef] [PubMed] [Google Scholar]
- Do the mechanical and chemical properties of InvisalignTM appliances change after use? A retrieval analysis. Eur J Orthod. 2016;38:27-31.
- [CrossRef] [PubMed] [Google Scholar]
- Structural conformation comparison of different clear aligner systems: An in vitro study. Dent J (Basel). 2022;10:73.
- [CrossRef] [Google Scholar]
- ATR-FTIR analysis of orthodontic Invisalign® aligners subjected to various in vitro aging treatments. Materials (Basel, Switzerland). 2021;14:818.
- [CrossRef] [Google Scholar]
- Advances in orthodontic clear aligner materials. Bioact Mater. 2023;22:384-403.
- [CrossRef] [Google Scholar]
- Clinical performances and biological features of clear aligners materials in orthodontics. Front Mater. 2022;2:819121.
- [CrossRef] [Google Scholar]
- Short-term chemical and physical changes in invisalign appliances. Aust Orthod J. 2009;25:34-40.
- [CrossRef] [PubMed] [Google Scholar]
- Intraoral aging of orthodontic materials: The picture we miss and its clinical relevance. Am J Orthod Dentofacial Orthop. 2005;127:403-12.
- [CrossRef] [PubMed] [Google Scholar]
- Effects of mechanical properties of thermoplastic materials on the initial force of thermoplastic appliances. Angle Orthod. 2012;83:476-83.
- [CrossRef] [Google Scholar]
- Structural conformation and leaching from in vitro aged and retrieved Invisalign appliances. Am J Orthod Dentofacial Orthop. 2004;126:725-8.
- [CrossRef] [PubMed] [Google Scholar]
- Effects of thermoforming on the physical and mechanical properties of thermoplastic materials for transparent orthodontic aligners. Korean J Orthod. 2018;48:316-25.
- [CrossRef] [PubMed] [Google Scholar]
- Effects of temperature changes and stress loading on the mechanical and shape memory properties of thermoplastic materials with different glass transition behaviours and crystal structures. Eur J Orthod. 2015;37:665-70.
- [CrossRef] [PubMed] [Google Scholar]
- Force delivery properties of thermoplastic orthodontic materials. Am J Orthod Dentofacial Orthop. 2008;133:228-34. quiz 328.e1
- [CrossRef] [PubMed] [Google Scholar]
- Influence of thermoplastic appliance thickness on the magnitude of force delivered to a maxillary central incisor during tipping. Am J Orthod Dentofacial Orthop. 2009;136:12-e1.
- [CrossRef] [Google Scholar]
- MicroCT X-ray comparison of aligner gap and thickness of six brands of aligners: An in-vitro study. Prog Orthod. 2020;21:12.
- [CrossRef] [Google Scholar]
- Optical properties of orthodontic aligners--spectrophotometry analysis of three types before and after aging. Prog Orthod. 2015;16:41.
- [CrossRef] [PubMed] [Google Scholar]
- Experimental characterization of the mechanical properties of PETG and PA6 thermoplastics. Contemp Eng Sci. 2018;11:3771-9.
- [CrossRef] [Google Scholar]
- Thermal properties of commonly used clear aligner systems as-received and after clinical use. Marquette University (Thesis);.
- [Google Scholar]
- Thermal and mechanical properties of amorphous copolyester (PETG)/LCP blends. Eur Polym J. 1999;35:1439-43.
- [CrossRef] [Google Scholar]
- Mechanical properties of “two generations” of teeth aligners: Change analysis during oral permanence. Dent Mater J. 2018;37:835-42.
- [CrossRef] [PubMed] [Google Scholar]


