

Translate this page into:
Evaluation of occlusion parameters using T-scan III in patients receiving fixed orthodontic treatment


*Corresponding author: Sanaz Sadry, Associate Professor, Department of Orthodontics, Faculty of Dentistry, Istanbul Aydin Universty, Florya, 34295, Istanbul, Turkey. sanazsadry@hotmail.com
-
Received: ,
Accepted: ,
How to cite this article: Sadry S, Giray B. Evaluation of occlusion parameters using T-scan III in patients receiving fixed orthodontic treatment. APOS Trends Orthod 2023;13:91-9.
Abstract
Objectives:
The aim of this study is to examine the relationship between occlusal factors and temporomandibular joint diseases (TMD).
Material and Methods:
In our study, 43 individuals who had fixed orthodontic treatment and 20 individuals who did not need treatment at Istanbul Aydin University Faculty of Dentistry Department of Orthodontics were included in the study. Evaluations were made at the beginning of treatment (T0) and at 6 months (T1). T-Scan® computerized Occlusion Analyzer was used to evaluate the number of contact points, occlusal force parameters during centric occlusion and lateral movements, and occlusion and disclusion times. Differences between groups were evaluated with Mann–Whitney or independent t-test, and within-group differences were evaluated with Wilcoxon sign test or paired t-test, depending on whether the data showed normal distribution or not.
Results:
There was no statistically significant distinction between the gender-based parameters and right and left joint of Joint Vibration Analysis record in all three groups (P > 0.05). At the beginning of orthodontic treatment, there was no statistical difference in the variables within the group and between the groups. As a result of the comparison between the beginning of treatment (T0) and the 6th month (T1), no significant difference was found between the parameters of the anterior/posterior occlusal force distribution of the right-left quadrant and the force distribution of the working and non-working sides in lateral movements, and the occlusion and disclusion time parameters. Maximum intercuspal position left/right (MxlntlTSCANT1) was found to be statistically significant at 6 months in individuals who received fixed orthodontic treatment with extraction compared to the none xtraction treatment group (P < 0.05).
Conclusion:
According to our research, T-scan is one of the best devices for the early detection of TMD, especially for people undergoing orthodontic treatment. T-scan offers fast, non-invasive, and repeatable occlusion recording.
Keywords
Orthodontic treatment
Occlusion analysis t-scan
Occlusion
Temporomandibular joint

INTRODUCTION
In the past, orthodontics has involved the treatment of teeth alone, with the main goal of achieving maximum intercuspation relative to each other, and esthetics; the current approach involves attempts to achieve centric relationship and centric occlusion along with functional occlusion, long-term stability, periodontal health, and esthetics.[1,2] The ideal temporomandibular joint position is defined as the position where the condyles are in their uppermost anterior position in the articular fossa, where the articular disks are properly positioned. This is the most stable position for the mandible in terms of the musculoskeletal system.[3,4] Ideal occlusion has been defined as the position of the condyles in centric relationship with maximal intercuspation.[5,6] The occlusion time is defined as the period from the time of the first tooth contact to that of maximum intercuspation during the closing movement, whereas disclusion time is defined as the time required for the bilateral separation of the premolars and molars during lateral movements.[7] Ideally, occlusion and disclusion times of <0.2 s and <0.5 s, respectively, are desirable. While a long disclusion time is considered to cause hyperactivity in the masseter and temporal muscles, a long occlusion time is associated with the presence of premature contact.[8,9] In addition, the occlusion and disclusion times in some studies have been reportedly longer than ideal in individuals with temporomandibular joint dysfunction.[10] With the T-scan system, it is stated that dynamic contact relations, occlusal force distributions, and disclusion and occlusion times can be evaluated both in maximum intercuspation and during lateral movements of the lower jaw.[11] In addition, the estimated error rate, sensitivity, and reliability of the measurements obtained with this system are 1%, 98%, and 97.2%, respectively, and it provides more advanced and reliable information than conventional methods used in the evaluation of occlusion.[12] However, none of the previous studies have adequately evaluated the occlusion using the T-scan III device during the active orthodontic treatment period.
On the other hand, no study has been found in the literature, in which occlusion was evaluated with T-scan III during the active orthodontic treatment period in individuals using T-scan. It is reported in the literature that the effect of occlusion on temporomandibular joint diseases (TMD) is 10–15%. While some studies investigating the role of temporomandibular joint (TMJ) disorders and occlusal factors found a positive relationship between signs and symptoms of TMJ diseases and Angle classification and occlusal guidance factors, no relationship was found in some studies. However, with the thought that malocclusion is the most important factor leading to TMJ disorders, irreversible occlusal adjustments are made by dentists today as in the past.[13]
The aim of this study is to determine the distribution of occlusal factors and whether there are changes in the joint due to this in individuals receiving fixed orthodontic treatment which states that the clinical inspection and history study used in the evaluation of TMD patients is less accurate asymptomatic subjects than when combined with computerized joint vibration analysis (JVA). The use of fresh machinery and means in patient inspection allows for stress-free, firm, and non-aggressive discovery of minor irregularities in the motorized function of the masticating scheme, enabling main protective, and healing techniques of increased importance in efficient therapeutic intervention.[14] The greatest accurate and wide-ranging potential for diagnosis can assist the four clinician develop a true plan for therapy. TMJ vibration analysis may be clinically appropriate as a demonstration checkup for patients with TMD. Not only can JVA detect an inner derangement but also since it is a vibrant examination, it can also determine how fit it has been changed. This allows the clinician to differentiate a healthy modified internal disturbance that does not require therapy. Through the whole vibration energy as a limit, the diagnostic warmth for the uneven joints is approximately 82%, while the investigative specificity for the joints with no sign of internal disturbance is approximately 75%. At the same stage, under the threshold, 98.3% of the unpaid asymptomatic helper with two-sided normal TMJ computerized tomography (CT) scanning was convoluted.[15] Hypothesis: Occlusal factors cause TMD in individuals undergoing fixed orthodontic treatment.
MATERIAL AND METHODS
Forty-three healthy individuals, aged between 16 and 30 years, who visited the Department of Orthodontics with class I malocclusion for fixed orthodontic treatment (with and without tooth extraction, 13 and 30 patients, respectively) were included in this study (treatment group); in addition, 20 individuals who have normal occlusion and did not need orthodontic treatment and undergo orthodontic treatment (control group) were included as well.
The study included patients who were systemically and periodontally healthy; treated using fixed orthodontic appliances; underwent symmetrical extraction of premolars, if required, for the purpose of orthodontic treatment; were not treated with orthognathic surgery; and who achieved optimum occlusion and treatment goals. Occlusal force data were collected from the patients at two different time points: Before treatment initiation (T0), and in the 6th month (T1) of treatment; the data from both timepoints were evaluated statistically. The fixed Edgewise Roth technique was applied to all patients for treatment. In the first 6 months of the treatments, 0.22 inch Roth bracket and 0.014 Ni-Ti arch wires were used for the lower and upper jaws to line up, and 0.016, 0.018 and 0.016X 0.022 Ni-Ti arch wires were used throughout the treatment course. The occlusal factors determined in our study were recorded as follows: Sagittal tooth relationship Angle classifications were made (a) Sagittal tooth relationship according to the intermaxillary relationship of the right first molar teeth. (b) Occlusal guides; lateral anterior guidance was recorded by asking the patient to shift the mandible from the maximum intercuspal position to the right and left. During this movement, if only the canines were in contact, the canine was considered as protective occlusion, and if one or more molars were in contact with the canine, group function occlusion was considered. When the patient slides the lower jaw forward, if there is contact with the anterior teeth, it was recorded as “Anterior guidance available,” otherwise “No anterior guidance.” (c) The presence of balancing party conflict and contact; when the patient shifts his teeth to the right or left, if there is tooth contact on the balancing side, it is considered as “balancing party contact,” if the balancer side makes tooth contact so as to eliminate the contact on the working side, it is considered as “balancing party conflict.”
The subjects sat in an upright position. Their maximum unassisted opening and lateral deflections were recorded clinically and entered into the computer with the BioPak software program. The headset device was then placed on the subject’s head with the sensors positioned over the TMJs; the subjects were instructed to watch the monitor where they observed an animation illustrating opening and closing mouth movement, synchronized to a metronome. They were, then, instructed to open their mouth as wide as they could and close, tapping their teeth together following and matching the animation and the metronome, in which they observed on the screen. As the subject performed the opening and closing with the JVA, the characteristic vibrations produced by the condyles were detected by the accelerometers and recorded in the computer. After the first set of JVA tracings were recorded the Research Diagnostic Criteria examination was performed, then a second set of JVA tracings were recorded [Figure 1].

- Joint vibration analysis record.
In our study, the T-scan III (Tekscan, Inc., South Boston, USA) system was used to analyze the number of contact points and occlusal force parameters associated with centric occlusion and eccentric movements. The T-scan III system consists of a foil/sensor, bite-fork (with small and large options), holding part, and software [Figures 2 and 3]. Each foil/sensor is 0.06–1-mm thick; there are approximately 1300–1500 sensors on the system that can detect even the smallest force. On connecting the device to the computer, the data received by the sensor can be evaluated during the recording and saved for subsequent analysis. This diagnostic device is compatible with Microsoft Windows (Microsoft Corp. USA) and requires a standard Intel processor computer and a minimum of 1 GB RAM. The G * Power (G * Power Ver.3.0.10, Kiel, Germany) package program was used to determine the number of individuals to be included in the study.

- Screen shot of force/timeline, two-dimensional and three-dimensional graph of maximum occlusal force recording taken.

- Display of working and non-working side frictional contacts.
Statistical analysis
In our study, for a power >80%, at least 15 patients were required in each group to achieve a significance level of α = 0.05. All statistical analyses were performed using the Statistical Package for the Social Sciences (SPSS) 22.00 (SPSS Inc., Chicago, IL, USA) for Windows. For each parameter, a normal value was determined using the arithmetic mean of all the values obtained. The Wilcoxon test was used to compare the qualitative data. The results were evaluated using 95% confidence interval and a significance level of P < 0.05. The distribution of the data was evaluated using the Shapiro–Wilk test. Since the quantitative data did not show a normal distribution in the comparison between the periods, they were evaluated using the Friedman test.
RESULTS
The average treatment duration for the 43 individuals in the treatment group was 6.1 ± 0.50 months, and the mean age was 16.22 ± 3.45 years [Table 1]. As shown in [Table 2], there was a statistically significant increase in the number of occlusal contact points at maximum intercuspation in the treatment group between T0 and T1 in the posterior regions (P < 0.05), anterior regions (P < 0.001), and in total (P < 0.001). No significant difference was observed between the treatment group at T0 and T1 and the control group in the number of anterior, posterior, and total occlusal contact points [Table 1]. Further, no significant difference was observed between the treatment group at T0 and T1 and the control group regarding the occlusal force distributions in the right anterior, right posterior, left anterior, and left posterior quadrant at maximum intercuspation [Table 2]. Moreover, no significant difference was observed between the treatment group at T0 and T1 and the control group regarding the occlusal force distribution in the right hemijaw and left hemi-jaw at maximum intercuspation [Table 3]. Similarly, no significant difference was observed between the treatment group at T0 and T1 and the control group regarding the force distributions in the right working and non-working side during lateral movements, and that in the left working and non-working sides [Table 4]. No statistically significant difference in occlusion time was observed between the treatment group at T0 and T1 and the control group. In addition, no statistically significant difference was observed in the disclusion time for the right and left sides between the treatment group at T0 and T1 and the control group [Table 5]. The correlation status is shown in Table 6. However, there was no statistically significant difference between Max total integral left/right sides (total integral, integral 300 Hz and Ratio) P > 0.05 [Figure 4].
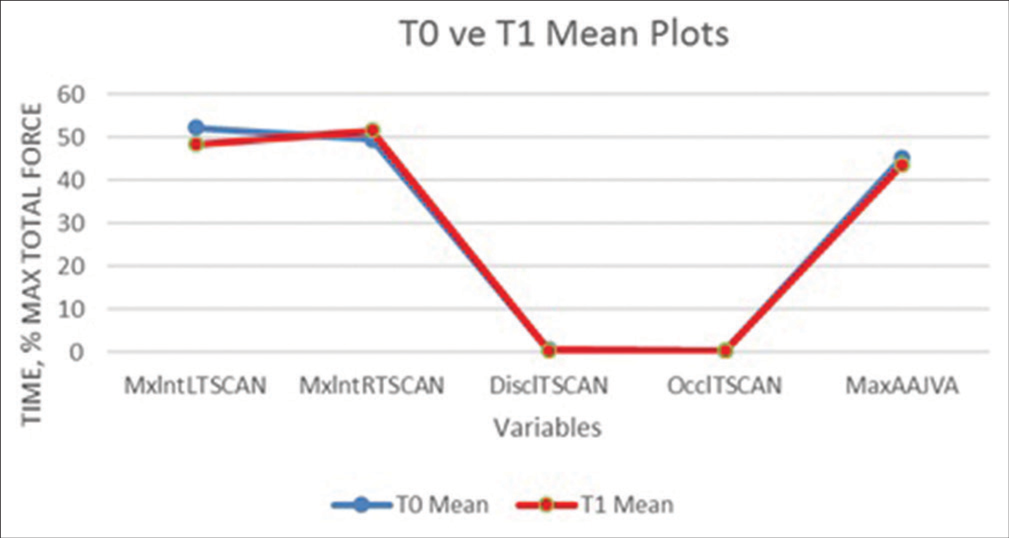
- Graphical distribution of measurements for different groups, beginning of treatment (T0) and at 6 months (T1).
| Number of occlusal contact points at maximum ıntercuspation | ||||||||||||
|---|---|---|---|---|---|---|---|---|---|---|---|---|
| Measurement intervals | Pairwise comparisons | |||||||||||
| T0 | T1 | C | T0-T1 | T0-C | T1-C | |||||||
| Mean±SD | Min–Max (median) | Mean±SD | Min–Max (median) | Mean±SD | Min–Max (median) | P | P | P | ||||
| Anterior Region | 10.02±1.8 | 6.27–15.10 (10.32) | 11.76±2.04 | 6.15–15.20 (11.02) | 12.71±2.60 | 4.25–15.06 (12.2) | 0.021 | * | 0.005 | ** | 0.446 | ns |
| Posterior Region | 22.62±4.35 | 10.4–30.18 (24.03) | 24.75±4.20 | 12.0–32.11 (25.1) | 25.24±4.26 | 12.35–35.7 (26.02) | 0.000 | *** | 0.000 | *** | 0.830 | ns |
| Total | 30.64±6.32 | 16.28–42.12 (33.45) | 36.48±6.80 | 20.80–47.35 (37.6) | 37.64±7.97 | 19.77–52.1 (37.51) | 0.000 | *** | 0.000 | *** | 0.303 | Ns |
Mean: Average, Sd: Standard deviation, ns: Nonsignificant, P<0.05: *, P<0.005: **, P<0.001: ***
| Occlusal force distribution at maximum ıntercuspation | ||||||||||||
|---|---|---|---|---|---|---|---|---|---|---|---|---|
| Measurement intervals | Pairwise comparisons | |||||||||||
| T0 | T1 | C | T0-T1 | T0-C | T1-C | |||||||
| Mean±SD | Min–Max (Median) | Mean±SD | Min–Max (median) | Mean±SD | Min–Max (median) | P | P | P | ||||
| Right Anterior Quadrant | 13.86±5.3 | 5.32–35.1 (15.89) | 12.64±6.12 | 4.75–28.67 (15.43) | 14.2±5.28 | 4.20–30.65 (15.71) | 0.225 | ns | 0.672 | ns | 0.110 | ns |
| Left Anterior Quadrant | 15.45±6.32 | 5.82–32.48 (13.51) | 14.24±7.16 | 6.33–32.66 (13.30) | 14.76±6.28 | 7.86–33.11 (13.05) | 0.275 | ns | 0.244 | ns | 0.562 | ns |
| Right Posterior Quadrant | 35.42±8.25 | 14.42–52.66 (34.84) | 34.02±7.23 | 11.35–46.75 (35.84) | 40.22±7.26 | 26.22–60.32 (41.05) | 0.533 | ns | 0.591 | ns | 0.422 | ns |
| Left Posterior Quadrant | 32.15±10.49 | 17.26–59.75 (30.10) | 33.04±8.61 | 21.32–55.27 (30.08) | 33.72±7.65 | 21.46–51.10 (31.65) | 0.475 | ns | 0.363 | ns | 0.688 | ns |
Mean: Average, Sd: Standard deviation, ns: Nonsignificant, P<0.05:*, P<0.005: **, P<0.001: ***
| Occlusal force distribution at maximum ıntercuspation | ||||||||||||
|---|---|---|---|---|---|---|---|---|---|---|---|---|
| Measurement intervals | Pairwise comparisons | |||||||||||
| T0 | T1 | C | T0-T1 | T0-C | T1-C | |||||||
| Mean±SD | Min–Max (median) | Mean±SD | Min–Max (median) | Mean±Sd | Min–Max (median) | P | P | P | ||||
| Right Hemi-Jaw | 48.21±8.16 | 22.51–61.76 (49.38) | 49.04±6.77 | 35.02–60.72 (50.45) | 50.89±7.15 | 35.62–65.43 (50.81) | 0.433 | NS | 0.544 | NS | 0.921 | NS |
| Left Hemi-Jaw | 51.13±8.06 | 37.21–74.73 (50.71) | 50.28±7.15 | 37.50–64.12 (49.74) | 50.52±7.47 | 38.46–63.44 (49.33) | 0.558 | NS | 0.375 | NS | 0.623 | NS |
Mean: Average, SD: Standard deviation, ns: nonsignificant, P<0.05: *, P<0.005: **, P<0.001: ***
| Force distribution in lateral movemen ts | ||||||||||||
|---|---|---|---|---|---|---|---|---|---|---|---|---|
| Measurement intervals | Pairwise comparisons | |||||||||||
| T0 | T1 | C | T0-T1 | T0-C | T1-C | |||||||
| Mean±SD | Min–Max (median) | Mean±SD | Min–Max (median) | Mean±SD | Min–Max (median) | P | P | P | ||||
| Right working side | 86.22±15.64 | 41.13–101.06 (87.44) | 88.34±10.87 | 62.21–101.10 (90.05) | 89.45±11.78 | 50.18–101.0 (91.27) | 0.083 | NS | 0.065 | NS | 0.937 | NS |
| Right non- working side | 15.16±15.34 | 0.00–58.86 (12.15) | 13.25±11.13 | 0.00–42.20 (12.05) | 13.06±12.14 | 0.00 –51.42 (8.15) | 0.70 | NS | 0.065 | NS | 0.721 | NS |
| Left working side | 88.13±11.25 | 51.4–101.05 (89.12) | 90.03±13.52 | 48.45–101.00 (96.32) | 88.78±13.95 | 52.4–100.0 (93.30) | 0.576 | NS | 0.661 | NS | 0.784 | NS |
| Left non- working side | 13.45±11.17 | 0.00–49.26 (13.15) | 12.13±13.78 | 0.00–57.11 (6.20) | 12.22±13.15 | 0.00–48.95 (7.05) | 0.612 | NS | 0.629 | NS | 0.973 | NS |
Mean: Average, SD: Standard deviation, NS: Non-significant, P<0.05: *, P<0.005: **, P<0.001: ***
| Occlusion and disclusion times | |||||||||||||
|---|---|---|---|---|---|---|---|---|---|---|---|---|---|
| Measurement intervals | Pairwise comparisons | ||||||||||||
| T0 | T1 | C | T0-T1 | T0-C | T1-C | ||||||||
| Mean ± SD | Min–Max (Median) | Mean ± SD | Min–Max (Median) | Mean ± SD | Min–Max (Median) | P | P | P | |||||
| Occlusion time | 0.38 ± 0.21 | 0.10–1.75 (0.28) | 0.28 ± 0.2 | 0.07–0.80 (0.25) | 0.33 ± 0.18 | 0.07–0.95 (0.32) | 0.276 | NS | 0.452 | NS | 0.420 | NS | |
| Disclusion time-right side | 2.45 ± 1.24 | 0.14–4.69 (2.69) | 2.67 ± 1.2 | 0.31–5.36 (2.69) | 2.58 ± 0.65 | 0.52–5.15 (2.35) | 0.689 | NS | 0.825 | NS | 0.812 | NS | |
| Disclusion time-Left side | 2.65 ± 1.12 | 0.28–6.25 (2.86) | 2.70 ± 1.18 | 1.00–4.86 (2.53) | 2.38 ± 1.15 | 0.55–5.33 (2.41) | 0.544 | NS | 0.233 | NS | 0.233 | NS | |
Mean: Average, SD: Standard deviation, NS: Non-significant, P<0.05: *, P<0.005: **, P<0.001: ***
| r | P | |
|---|---|---|
| T-scan | 0.824 | <0.001 |
| JVA | 0.781 | <0.001 |
JVA: Joint vibration analysis, r: Spearman’s rho correlation coefficient
DISCUSSION
Orthodontic treatment is not only to align the teeth but also to evaluate chewing functions before, during and after orthodontic treatment, both physiologically and for the comfort of the patient. There are many studies in the literature that examine the relationship between chewing functions, bite force, chewing pattern, and malocclusion types. Chewing muscle functions can be considered as an environmental factor that plays an important role in chroniofacial growth. Today, with the development of the food industry, the incidence of malocclusion has increased considerably compared to primitive societies. This situation arises as a result of the decrease in the forces applied to the jaws as a result of the consumption of refined soft foods, that is, the chewing functions, and the premature loss of the milk teeth due to caries.[14] In the literature, the classification of eight types of chewing patterns is used. It is difficult to distinguish between these patterns. Because it is a subjective evaluation and the transitions between them are very smooth. Angle Class I, Class II individuals, and deep bite groups have similar chewing patterns, while cross-bite groups have reverse chewing patterns.[15]
In orthodontic treatments, tooth extraction is a method frequently implemented by orthodontists to make space in cases with excessive space restriction in the jaw. Providing three-dimensional control during retraction of canines in extraction treatments is of great importance for the stability of orthodontic treatment.[16] Therefore, success in orthodontic treatments depends on the treatment mechanics as well as a good treatment plan.
In our study, there was a significant increase in the number of posterior, anterior, and total contact points in the individuals who underwent fixed orthodontic treatment (with and without extraction) between T0 and T1. There is a lack of studies in the literature regarding the changes in occlusion analysis values of the number of contact points before and after individuals orthognathic surgery, with and without fixed orthodontic treatment.[17-19]
In our study, the distribution of forces in the teeth varied between 0% and 40%, and the greatest force was concentrated on the first molars, followed by the second molars and first premolars, respectively. The lateral incisors were subjected to the least amount of force. Okeson[2] has stated that occlusal forces are affected by several factors such as age, sex, skeletal morphology, and malocclusion, and that the first molars are subjected to the greatest force during chewing. Qadeer et al.[20] compared the occlusal strength parameters in 25 individuals with Angle class I relationship with and without orthodontic treatment using T-Scan III, and in both groups, the largest amount of force was concentrated on the second molars, followed by the first molars and second premolars, respectively. They reported the lateral incisors being subjected to lesser forces. They also stated that the distribution of forces on the teeth within the arch varied between 0% and 35%. These findings correspond to the results of our study.
In our study, there was no significant change between T0 and T1 in terms of force per tooth. Moreover, the occlusal forces were distributed equally in the right and left jaws, and there was no significant change in the occlusal force distribution in the right and left jaws between T0 and T1. In another study, the occlusal forces observed in the right and left hemispheres demonstrated a balanced distribution not exceeding 50% for one side.[21-23] The findings in these studies are consistent with the results of our research.
In our study, a significant difference was observed between the extraction and non-extraction orthodontic treatment groups regarding the balanced forces (MxIntLTSCANT1 and MxntRTSCANT1) in the left and right maximum intercuspidation position. In the study conducted by Henrikson et al.,[24] orthodontic treatments with and without extraction were considered important in terms of the prevalence of TMD, and it was stated that the changes in occlusion during orthodontic treatment may have an important role in terms of TMD. In our study, even though there was no significant difference between the duration of disclusion and occlusion, as Henrikson et al. have stated, group-based changes should be approached in a more protective manner in terms of TMD.[24] Considering the results of our study, it was determined that the occlusal force distributions observed in the right anterior, left anterior, right posterior, and left posterior quadrants, and right and left hemi-jaws in the treatment group at T0 and T1 were similar to those of the individuals with Angle class I relationship (control group). In our study, the distribution of forces in the lateral movements varied between 86.45 ± 15.64 and 88.75 ± 12.24 for the working side and between 11.03 ± 14.80 and 14.06 ± 16.54 for the non-working side.
Studies have reported that in healthy individuals, the incidence of group-function occlusion is higher than that of canine-sparing occlusion.[25,26] Moreover, it has been stated that the non-working side contacts observed in individuals who have undergone orthodontic treatment are similar to those of healthy individuals who have not undergone treatment, with a higher incidence of group function occlusion pattern in the former, compared to canine-protected occlusion.[27] These findings are similar to the results of our research. Qadeer et al.[6] have stated in their study that the increase in force distribution on the non-working side in individuals who have undergone orthodontic treatment was caused by the contacts that especially occurred on the second molar tooth. In the individuals included in our study, it was determined that the force distribution on the working and non-working side was similar to those of the individuals with Angle’s class I relationship who did not undergo orthodontic treatment. There is no previous study in the literature investigating the change in the distribution of forces on the working and non-working sides during fixed orthodontic treatment in individuals with extraction cases. In our study, no statistically significant difference was observed in the treatment group between T0 and T1 in terms of force distribution on the working and non-working sides. The time from the first tooth contact to maximum intercuspation during the closing movement is defined as the occlusion time.[28] In our study, it was observed that the occlusion time was 0.36 ± 0.35 and 0.32 ± 0.20 s in the treatment group at T0 and T1, respectively, and 0.29 ± 0.18 s in the control group. In Addition, no statistically significant difference was observed between the treatment group at T0 and T1, and the control group, in terms of the occlusion times. A longer occlusion time (ideal occlusion time is desired to be <0.2 s) indicates the presence of premature contact during closure and negatively affects occlusal stability.[11,15] In contrast, Qadeer et al.[6] have stated that the average occlusion time was 0.38 s in individuals who underwent orthodontic treatment and 0.41 s in individuals who did not undergo orthodontic treatment. These results are consistent with the results of our research.
In a study evaluating the relationship between the duration of disclusion and the maximum bite force, it was reported that greater bite forces were observed in individuals whose disclusion duration was reduced to <0.5 s.[12] In our study, no statistically significant difference was observed in the treatment group between T0 (with and without extraction) and T1 in terms of disclusion times. Based on the results of our study, the period of disclusion was longer than normal in individuals who underwent orthodontic treatment. Kerstein and Radke[29] have reported that the presence of group function contacts on the working side prolongs the disclusion time. Hence, the observation of group function occlusion pattern in the individuals included in our study was a factor of prolonged disclusion time.
When evaluated together with the results of our study, this research shows that canine-sparing occlusion can protect the person from developing TMJ. Our result is supported by some studies. Some other studies have reported that occlusal guidance has no effect on TMD. Butler et al.[30] found no relationship between lateral occlusal guidance and joint sounds and muscle tenderness in their study with 56 patients. Roberts et al.[31] compared individuals with disc displacement and normal disk position and found no difference in terms of occlusal guidance. Runge et al.[32] evaluated the relationship between joint sounds and occlusion in their study on 226 pre-orthodontic individuals. They did not find any relationship between working or non-working side contacts and joint sounds.
Orthodontic treatment has no side effects on the joint, but every step of orthodontic treatment should be planned by reviewing all stomatognathic systems and findings. In orthopedic treatments applied to individuals with growth modification, the tolerance of TMJ is high, but excessive, prolonged, and uncontrolled force should be avoided in treatments applied to both adults and growing individuals.
Our study has the following limitations. First, we did not separate the extraction cases according to the arch and obtained occlusal records at only two timepoints. Researchers who are considering a study on a similar subject may separate the extraction cases according to maxilla only, or maxilla and mandible, and should obtain occlusal records at the beginning, inter-treatment, and end-of-treatment periods to avoid early contacts and occlusal changes, which, in turn, would prevent complications such as joint disorders and asymmetry. Second, our sample size was small. A study with a larger sample size, which is divided into groups according to different malocclusions is recommended, along with a follow-up to identify the effects of different orthodontic treatments on occlusion and relapse.
CONCLUSION
Thus, the number of occlusal contact points were increased in both the individuals who underwent and did not undergo fixed orthodontic treatment at T1. Moreover, there was no significant difference in the treatment group between T0 and T1 regarding the parameters of occlusal force distribution in each tooth region, that in the right anterior, right posterior, left anterior, and left posterior quadrant, that in the right and left hemi-jaw, that on the working and non-working side in lateral movements, and occlusion and disclusion time. The occlusal force distributions in the right and left half jaws were symmetrical, the right and left disclusion times were longer than the normal values, the group-function occlusion pattern was observed, and the force distributions on the working and non-working sides of individuals who underwent orthodontic treatment were similar to those with normal occlusion. The relationship between occlusal factors and TMD has been controversial for years and there is no consensus in the literature yet. In our study, canine-preserving occlusion and balancing side contact were found more in individuals who received fixed orthodontic treatment, and group function and balancing side contact were found more in individuals who did not. TMD should be approached considering that TMD has a multifactorial etiology and there is not yet definitive scientific evidence that a certain occlusal factor will cause TMD. In addition, it is thought that providing occlusal stability both statically and functionally by applying treatments aimed at balancing occlusal force distributions and reducing the disclusion time may be effective in reducing future joint problems.
With the use of Tscan and JVA for the preliminary diagnosis of joint disorders, it provides accurate diagnosis and treatment planning by reducing the extra radiation intake and (CT-MR) intake of patients.
Declaration of patient consent
The authors certify that they have obtained all appropriate patient consent.
Conflicts of interest
There are no conflicts of interest.
Financial support and sponsorship
Nil.
References
- The maintenance system and occlusal dynamics. Dent Clin North Am. 1976;20:761-88.
- [CrossRef] [PubMed] [Google Scholar]
- Management of Temporomandibular Disorders and Occlusion (7th ed). St Louis: Elsevier/Mosby; 2013.
- [Google Scholar]
- Occlusion time, occlusal balance and lateral occlusal scheme in subjects with various dental and skeletal characteristics: A prospective clinical study. J Oral Rehabil. 2020;47:1503-10.
- [CrossRef] [PubMed] [Google Scholar]
- Comparison of the occlusal contact area of virtual models and actual models: A comparative in vitro study on Class I and Class II malocclusion models. BMC Oral Health. 2018;18:109.
- [CrossRef] [PubMed] [Google Scholar]
- Comparison of closure occlusal force parameters in post-orthodontic and non-orthodontic subjects using T-Scan III DMD occlusal analysis. Cranio. 2016;34:395-401.
- [CrossRef] [PubMed] [Google Scholar]
- Evaluation of the effects of modified bonded rapid maxillary expansion on occlusal force distribution: A pilot study. Eur J Dent. 2016;10:103-8.
- [CrossRef] [PubMed] [Google Scholar]
- T-scan III system diagnostic tool for digital occlusal analysis in orthodontics-a modern approach. Pril (Makedon Akad Nauk Umet Odd Med Nauki). 2014;35:155-60.
- [CrossRef] [PubMed] [Google Scholar]
- Occlusion time analysis in military pilots affected by bruxism. Sci Rep. 2019;5;9:1408.
- [CrossRef] [PubMed] [Google Scholar]
- The association between occlusion time and temporomandibular disorders. J Electromyogr Kines. 2015;25:151-4.
- [CrossRef] [PubMed] [Google Scholar]
- Computerized occlusal analysis: Correlation with occlusal indexes to assess the outcome of orthodontic treatment or the severity of malocculusion. Korean J Orthod. 2016;46:27-35.
- [CrossRef] [PubMed] [Google Scholar]
- The influence of occlusal morphology on occlusion time. Cranio. 2017;35:101-9.
- [CrossRef] [PubMed] [Google Scholar]
- Temporomandibular disorders: A review of current concepts in etiology, diagnosis, and management. Oral Surg. 2020;13:321-34.
- [CrossRef] [PubMed] [Google Scholar]
- Vibration analysis of the temporomandibular joints with meniscal displacement with and without reduction. Cranio. 1993;11:192-201.
- [CrossRef] [PubMed] [Google Scholar]
- Efect of malocclusion on jaw motor function and chewing in children: A systematic review. Clin Oral Investig. 2022;26:2335-51.
- [CrossRef] [PubMed] [Google Scholar]
- Chewing patterns in subjects withnormal occlusion and with malocclusions. Semin Orthod. 2006;12:138-49.
- [CrossRef] [Google Scholar]
- Tooth extractions in Orthodontics: First or second premolars? Dental Press J Orthod. 2019;24:88-98.
- [CrossRef] [PubMed] [Google Scholar]
- Extractions, retention and stability: The search for orthodontic truth. Eur J Orthod. 2017;39:109-15.
- [CrossRef] [PubMed] [Google Scholar]
- Modifications in Class I and Class II Div. 1 malocclusion during orthodontic treatment and their association with TMD problems. Cranio. 2021;39:65-73.
- [CrossRef] [PubMed] [Google Scholar]
- Comparison of excursive occlusal force parameters in post-orthodontic and non-orthodontic subjects using T-Scan® III. Cranio. 2016;9634:1-8.
- [CrossRef] [PubMed] [Google Scholar]
- Assessment of occlusion with the T-Scan system in patients undergoing orthognathic surgery. Sci Rep. 2017;7:5356.
- [CrossRef] [PubMed] [Google Scholar]
- Criteria for optimum functional occlusion In: Okeson JP, ed. Management of Temporomandibülar Disorders. United States: Mosby Elsevier; 1993. p. :95-110.
- [Google Scholar]
- Rationale for the Use of T-Scan Occlusal Analysis in Orthodontics. Adv Dent Technol Tech. 2020;3:1.
- [Google Scholar]
- Signs of temporomandibular disorders in girls receiving orthdontic treatment. A prospective and longitudinal comparision with untreated Class II malocclusion and normal occlusion. Eur J Orthod. 2000;22:271-81.
- [CrossRef] [PubMed] [Google Scholar]
- The relationship between non-working-side occlusal contacts and mandibular position. J Oral Rehabil. 2001;28:976-81.
- [CrossRef] [PubMed] [Google Scholar]
- Functional occlusal patterns during lateral excursions in young adults. J Prosthet Dent. 2015;113:571-7.
- [CrossRef] [PubMed] [Google Scholar]
- Functional analysis of rhythmic jaw movements evoked by electrical stimulation of the cortical masticatory area during low occlusal loading in growing rats. Front Physiol. 2020;11:34.
- [CrossRef] [PubMed] [Google Scholar]
- Investigation of the association between orthodontic treatment and temporomandibular joint pain and dysfunction in the South Korean population. Korean J Orthod. 2019;49:181-7.
- [CrossRef] [PubMed] [Google Scholar]
- Masseter and temporalis excursive hyperactivity decreased by measured anterior guidance development. Cranio. 2012;30:243-54.
- [CrossRef] [PubMed] [Google Scholar]
- A descriptive survey of signs and symptoms associated with myofascial pain-dysfunction syndrome. J Am Dent Assoc. 1975;90:635-9.
- [CrossRef] [PubMed] [Google Scholar]
- Correlation of clinical parameters to the arthrographic depiction of temporomandibular joint internal derangements. Oral Surg Oral Med Oral Pathol. 1988;66:32-6.
- [CrossRef] [PubMed] [Google Scholar]
- The relationship between temporomandibular joint sounds and malocclusion. Am J Orthod Dentofacial Orthop. 1989;96:36-42.
- [CrossRef] [PubMed] [Google Scholar]


