

Translate this page into:
Evaluation of orthodontic archwire and microbial adhesion during orthodontic therapy


*Corresponding author: Saumya Saini, Department of Orthodontics, SGT University, Gurgaon, Haryana, India. saumya.saini.s@gmail.com
-
Received: ,
Accepted: ,
How to cite this article: Saini S, Kumar T, Kumar S, Tomer G, Tripathi D, Khanna M. Evaluation of orthodontic archwire and microbial adhesion during orthodontic therapy. APOS Trends Orthod. doi: 10.25259/APOS_201_2024
Abstract
Objectives
The study was done to assess the changes in surface roughness and composition after usage of Nickel-titanium (NiTi) and Stainless steel (SS) archwire and to compare the microbial adhesion relevant to surface roughness.
Material and Methods
The samples of orthodontic archwire were divided into 3 major groups – Group A consisted of NiTi wire (0.014”), which was further divided into 2 groups – Control (A1) and Case–control group. Group B consisted of SS round wire (0.016”), which was divided into 2 groups – control (B1) and case–control (B2), and Group C consisted of SS rectangular (0.016 × 0.022”), which was divided into 2 groups – control (C1) and case–control group (C2). Samples were studied through scanning electron microscopy (SEM) with energy-dispersive X-ray spectroscopy and microbial culture at intervals of 0 and 1 month. SEM was done at ×500 and ×1000 magnification.
Result
The surface roughness of NiTi and SS archwire increases with usage. NiTi archwire composition alters with usage and a significant decrease in Nickel content. SS archwire composition also changes with the usage and a significant decrease in iron (Fe) and chromium (Cr) content. The anterior and posterior segments of the NiTi and SS, on comparison, show similar changes in surface and composition.
Conclusion
The microbial culture of the NiTi and SS shows no significant growth of Streptococcus mutants, Lactobacilli, and Candida albicans. Staphylococcus aureus culture was found in 3 cases of NiTi archwire but did not correlate with the surface roughness or the composition of the archwire.
Keywords
Scanning electron microscopy
X-ray spectroscopy
Nickel-titanium-archwire
Stainless steel-archwire
Microbial-culture
Surface roughness

INTRODUCTION
Orthodontic fixed appliance therapy is the most common method of treating malocclusions. The important components of fixed appliance therapy are brackets, chains, buccal tubes, band material, ligating materials, and archwires. Archwires transfer the forces on the tooth for planned tooth movement during the treatment.
The oral environment is harsh due to temperature changes, acidity, and chewing forces, which leads to surface changes and microbial adhesion on the archwires. Orthodontic archwire’s roughness plays an important role when assessing the efficiency of archwire-guided movement of the tooth, corrosive action, contact with the surface, and friction. Surface roughness increases the contact area between the bracket and the archwire, which can lead to an increase in frictional forces. This can, therefore, lengthen the orthodontic treatment period by reducing the orthodontic forces by 50% or more.[1]
Scanning electron microscope (SEM) is a useful tool for directly studying the surfaces of materials. Using energy-dispersive X-ray spectroscopy (EDX), which is paired with SEM, may identify the elemental makeup of a material surface. Material assessment, contaminant identification, spot detection analysis, and other tasks are included in the use of EDX.[2]
Maintaining proper oral hygiene is frequently made more difficult for orthodontic patients after receiving a fixed appliance. The appliances’ components prevent proper access to the tooth surfaces for the best cleaning results and give microorganisms new places to reside.[3]
Hence, in this study, we are interested in evaluating the surface changes in Stainless steel (SS) and Nickel-titanium (NiTi) archwires during the fixed orthodontic treatment at various time intervals and the relevant microbial adhesion.
MATERIAL AND METHODS
The study was conducted on 8 patients who report to the Department of Orthodontics and Dentofacial Orthopedics, Faculty of Dental Sciences, SGT University, Gurugram, for fixed orthodontic treatment. A total of 54 samples were collected for SEM-EDX (ultra plus: 4322, Oxford instrument- 66553) and were sent to IIT-Roorkee, Uttrakhand, and the same 54 samples for microbial swabs were taken, collected, and sent to the Department of Microbiology, SGT University, Haryana for microbial culture. The growth was then observed and quantified by colony-forming units. The samples were selected based on inclusion criteria such as patient undergoing fixed orthodontic treatment, good oral hygiene, age group (13–25 years), and moderate crowding in the upper arch, and exclusion criteria were periodontal infection, medically compromised patients, and dental/craniofacial anomalies.
Samples were taken based on Archwire (Prime Ortho) dimensions and pre and post-insertion in patients. The samples are divided into 3 major groups
Group A consisted of NiTi wire (0.014”) which was further divided into 2 groups – Control (A1) and Case– control group (A2); case control was again divided into anterior and posterior segments.
Group B consisted of SS round wire (0.016”), which was divided into 2 groups – control (B1) and case-control (B2); case control was again divided into Anterior and Posterior segments.
Group C consisted of SS rectangular (0.016 × 0.022”), which was divided into 2 groups – control (C1) and case–control group (C2); case control was again divided into Anterior and Posterior segments.
Samples were taken from the upper arch and were studied through SEM-EDX and microbial culture at intervals of 0 and 1 month. T0 (0-month) - The 2 samples were taken from the unused archwire pack. T1 (1-month interval) - 16 samples were taken from the archwire used in the patient’s mouth in 2 different segments: (1) Anterior segment close to the midline and (2) Posterior segment close to the 1st molar.
During sample collection, the wires were removed from the area closer to the midline and the posteriors carefully without instrumentation. The wire was then removed from the patient’s mouth and the collected archwire sample was rinsed with distilled water to detach any loosely bound precipitates. A 10 mm piece was cut with a distal-end cutter for all the samples retrieved. The wires were then placed in sterilization pouches or containers and taken for SEM analysis for surface characteristics such as lines, grooves, pitting, and indentations. Samples were evaluated at ×500 and ×1000 magnifications using SEM and the elemental composition by EDX [Figure 1].
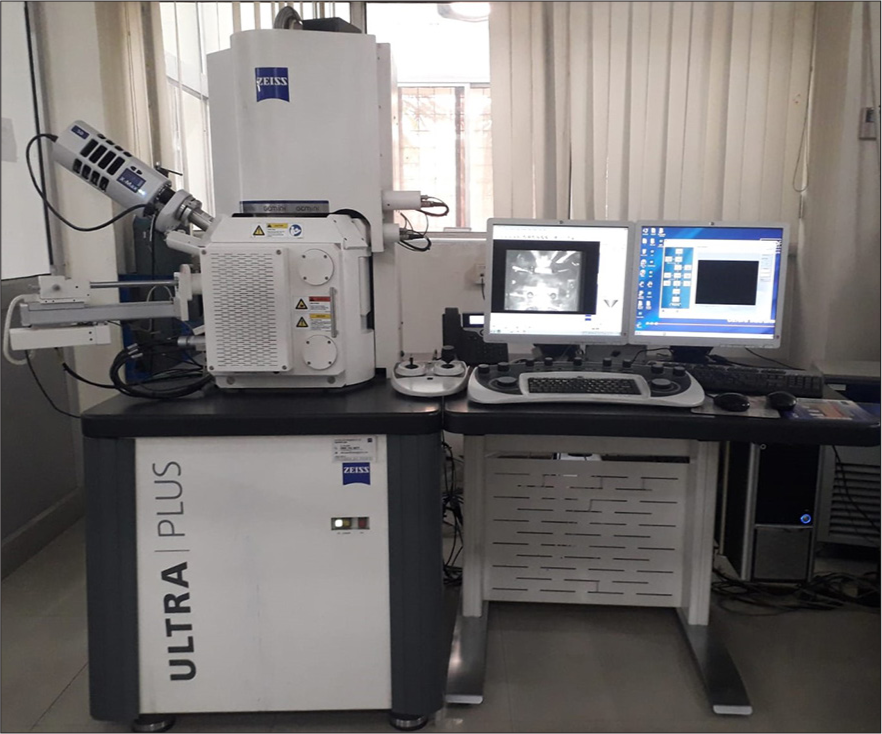
- Scanning electron microscopy with energy-dispersive X-ray spectroscopy machine.
SEM was used at ×500 and ×1000 magnification to assess the micromorphological characteristics of the archwires. Each specimen was mounted [Figure 2] on a holder and observed under a field-emission SEM apparatus (Fe-SEM Zeiss Ulta Plus). This system also was equipped with an energy-dispersive X-ray spectrophotometer (EDX) to analyze the chemical composition of the wire. The EDX received and analyzed the X-ray energy spectrum dispersed from the surface to distinguish the composition of the wire materials. Microbial swabs were collected from the same area close to the midline and the posterior area from where the wire sample was taken. The swab stick was rolled on the wire carefully without touching to mucosa, and the collected samples were transferred to normal saline [Figure 3]. The sample was then carried onto the agar plate, and the sterilized inoculated loop was used to make the streak on the agar plate. The samples were then incubated at 37°C in atmospheric pressure for 24 h and then growth was observed for Streptococcus mutans, Staphylococcus aureus, Lactobacilli, and Candida albicans. The growth was observed and quantified by colony-forming units.
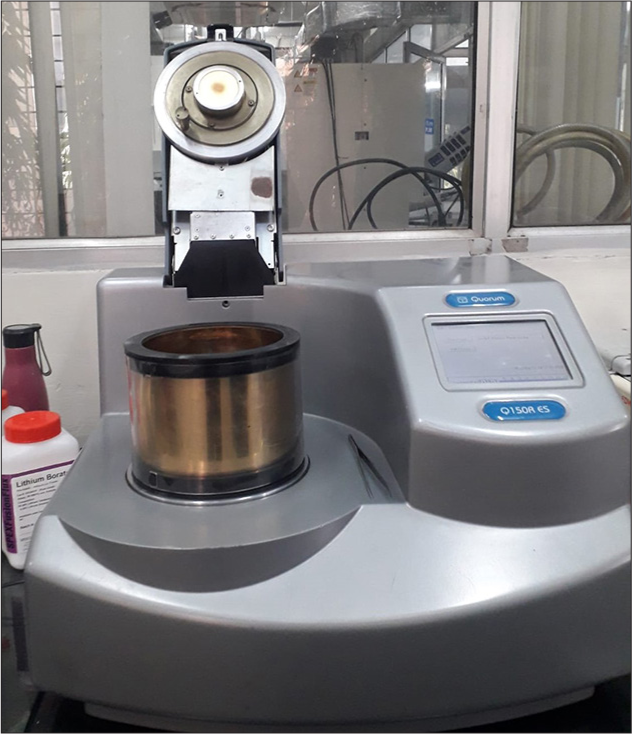
- Specimen holder apparatus.
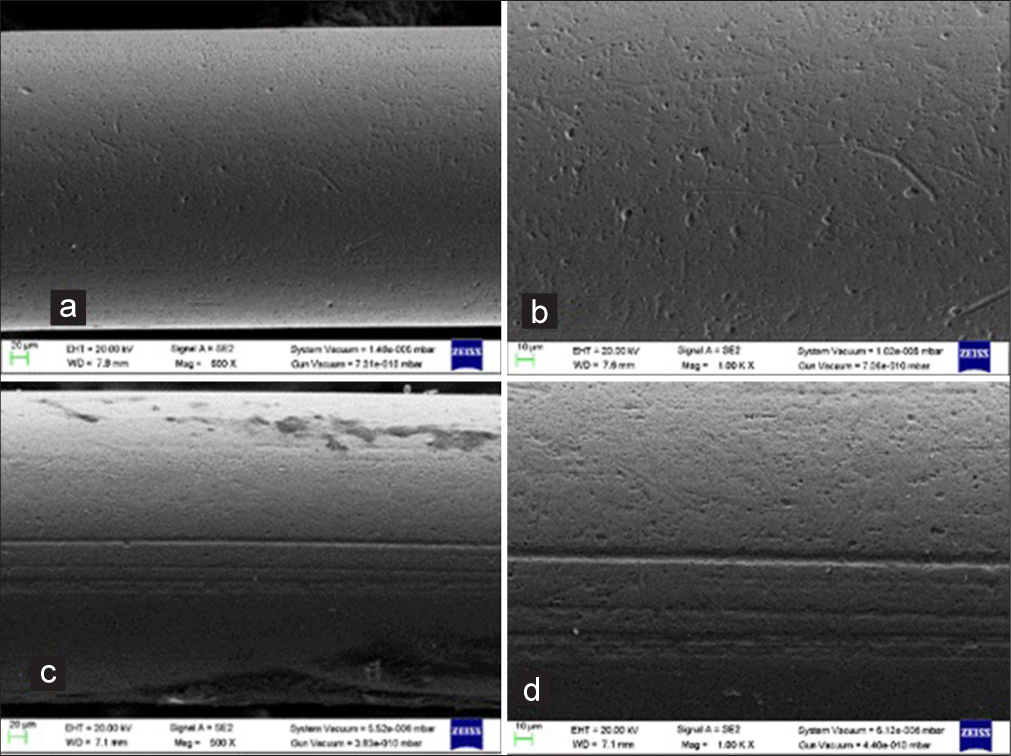
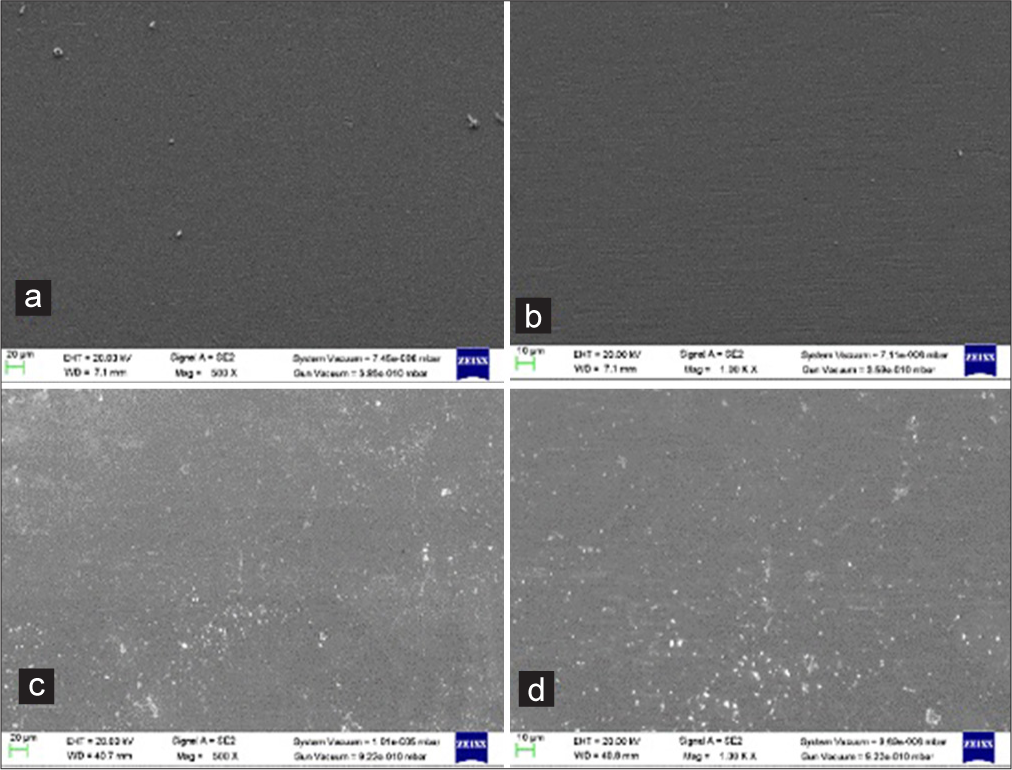
- Scanning electron micrographs of the Nickel-titanium (NiTi) (0.014”) wires: ×500 and ×1000 magnification- (a and b) shows unused NiTi wire surface; (c and d) shows used NiTi wire surface.
Statistical analysis
A power analysis was established by G Power software version 3.1.9.7 for sample calculation. The data for the present study were entered in Microsoft Excel 2007 and analyzed using the Statistical Package for the Social Sciences statistical software 23.0 Version. The descriptive statistics included mean, standard deviation frequency, and percentage. The level of significance for the present study was fixed at 5%. The intergroup comparison will be done using the independent t-test. The Shapiro–Wilk test was used to investigate the distribution of the data, and Levene’s test to explore the homogeneity of the variables.
RESULTS
SEM evaluation of the surface topography
Group A (NiTi 0.014”)
Group A1 (NiTi 0.014”) control group
Under ×500 and ×1000 magnification, a scan of the unused NiTi 0.014” archwire revealed significant roughness and displayed regular, noticeable ridges and striations interspersed with voids, which may have been caused by the manufacturing process [Figure 3a and b].
Group A2 (NiTi 0.014”) case group
Under ×500 and ×1000 magnification, a scan of the 1-month used NiTi 0.014 deep fissures and craters was uniformly distributed across the archwire [Figure 3c and d].
Group B (SS round 0.016”)
Group B1 (SS round 0.016”) control group
Under ×500 and ×1000 magnification, a scan of the unused SS Round 0.016” wire showed uniform prominent striations and ridges [Figure 4a and b].
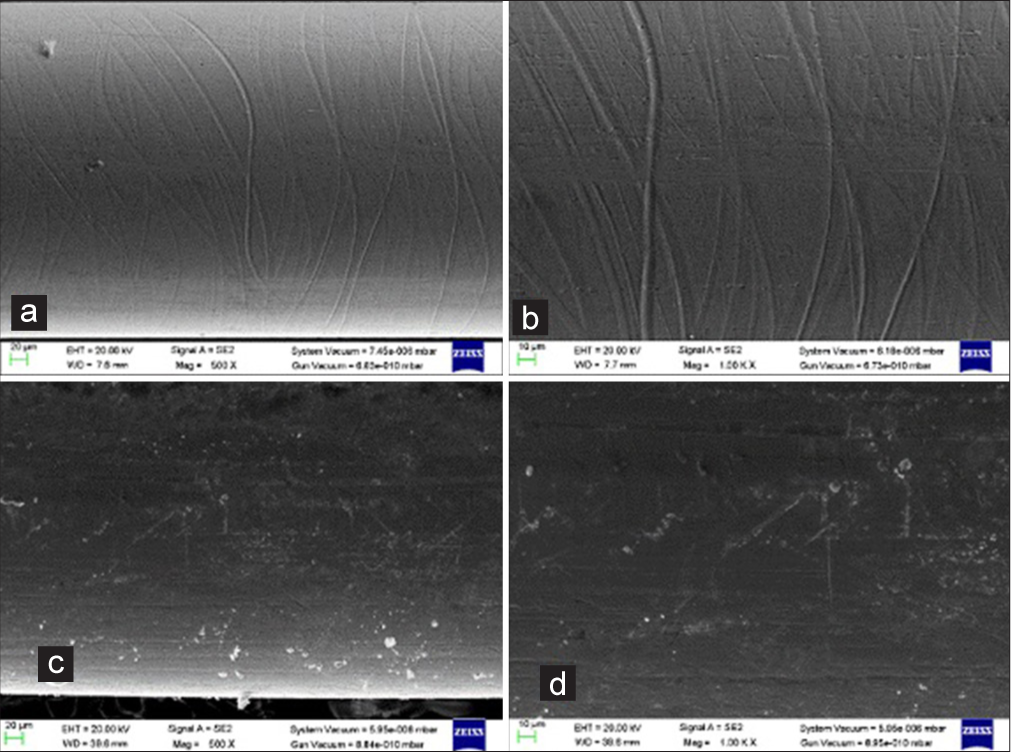
- Scanning electron micrographs of the stainless steel (SS) Round (0.016”) wires: ×500 and ×1000 magnification- (a and b) shows unused SS Round (0.016”) wire surface; (c and d) shows used round (0.016”) wire surface.
Group B2 (SS round 0.016”) case group
Under ×500 and ×1000 magnification, a scan of the 1 month-used SS Round 0.016” wire showed uniformly noticeable voids and striations, as well as a large number of contaminants plugging into the wire’s surface [Figure 4c and d].
Group C (SS rectangular 0.016 × 0.022”)
Group C1 (SS rectangular 0.016 × 0.022”) control group
Under ×500 and ×1000 magnification, a scan of the unused SS rectangular 0.016 × 0.022” wire showed an overall smooth surface, and contaminants were discovered plugged into the wire’s surface [Figure 5a and b].
- Scanning electron micrographs of the Stainless steel (SS) Rectangular 0.016 × 0.022” ) wires: ×500 and ×1000 magnification- (a and b) shows unused SS Rectangular (0.016 × 0.022” ) wire surface; (c and d) show used SS rectangular (0.016 × 0.022” ) wire surface.
Group C2 (SS rectangular 0.016 × 0.022”) case group
Under ×500 and ×1000 magnification, a scan of the 1 month used SS rectangular 0.016 × 0.022” wire showed multiple small ovoid areas and small craters, noticeable ridges, and striations [Figure 5c and d].
EDX
The mean Nickel (Ni) in the Control Group (A1) was 45.13 ± 0.14, and in the Anterior Group (A2) was 27.04±18.89, and comparison between the Control (A1) and Anterior (A2) was statistically significant [Table 1]. The mean Ni in the Control Group (A1) was 45.13 ± 0.14 and in the Posterior Group (A2) was 27.07 ± 18.84, and comparison between the Control (A1) and the Posterior (A2) was statistically significant [Table 2]. The mean Chromium in the Control Group (B1) was 14.76 ± 0.077 and in the Anterior Group (B2) was 14.13 ± 0.741, and comparison between the Control (B1) and Anterior (B2) was statistically significant. The mean Manganese in the Control Group (B1) was 1.01 ± 0.014 and in the Anterior Group (B2) was 1.19 ± 0.216, and comparison between the Control (B1) and Anterior (B2) was statistically significant. The mean Iron in the Control Group (B1) was 52.84 ± 0.077 and in the Anterior Group (B2) was 50.41 ± 2.904, and comparison between the Control (B1) and anterior (B2) was statistically significant [Table 3]. The mean Chromium in the Control Group (B1) was 14.76 ± 0.077, and in the Posterior Group (B2) was 14.18 ± 0.537, and the comparison between the Control (B1) and Posterior (B2) was statistically significant. The mean Manganese in the Control Group (B1) was 1.01 ± 0.014 and in the Posterior Group (B2) was 1.20 ± 0.217, and comparison between the Control (B1) and Posterior (B2) was statistically significant. The mean Iron in the Control Group (B1) was 52.84 ± 0.077 and in the Posterior Group (B2) was 50.95 ± 3.290, and comparison between the Control (B1) and Posterior (B2) was statistically insignificant [Table 4].
| NiTi | Groups | Mean (wt%) | Standard deviation | Standard error | t-value | P-value |
|---|---|---|---|---|---|---|
| C | Control | 18.40 | 0.28 | 0.104 | 1.17 | 0.288 |
| 22.54 | 9.37 | 2.312 | ||||
| Ti | Control | 36.47 | 0.14 | 0.073 | 0.517 | 0.627 |
| 33.81 | 6.87 | 2.456 | ||||
| Ni | Control | 45.13 | 0.14 | 0.054 | 2.71 | 0.030* |
| 27.04 | 18.89 | 2.567 |
| NiTi | Groups | Mean (wt%) | Standard deviation | Standard error | t-value | P-value |
|---|---|---|---|---|---|---|
| C | Control | 18.40 | 0.28 | 0.112 | 1.16 | 0.291 |
| 22.52 | 9.42 | 2.378 | ||||
| Ti | Control | 36.47 | 0.14 | 0.071 | 0.514 | 0.629 |
| 33.85 | 6.82 | 2.984 | ||||
| Ni | Control | 45.13 | 0.14 | 0.054 | 2.71 | 0.030* |
| 27.07 | 18.84 | 2.688 |
| SS | Group | Mean (wt%) | Standard deviation | Standard error | t-value | P-value |
|---|---|---|---|---|---|---|
| C | Control | 21.23 | 0.028 | 0.020 | 1.392 | 0.207 |
| 22.45 | 2.493 | 0.881 | ||||
| O | Control | 4.06 | 0.035 | 0.025 | 2.936 | 0.076 |
| 5.13 | 1.456 | 0.514 | ||||
| SI | Control | 0.34 | 0.021 | 0.015 | 0.456 | 0.612 |
| 0.37 | 0.139 | 0.052 | ||||
| Cr | Control | 14.76 | 0.077 | 0.055 | 2.363 | 0.049* |
| 14.13 | 0.741 | 0.262 | ||||
| Mn | Control | 1.01 | 0.014 | 0.010 | 2.363 | 0.049* |
| 1.19 | 0.216 | 0.076 | ||||
| Fe | Control | 52.84 | 0.077 | 0.055 | 2.368 | 0.050* |
| 50.41 | 2.904 | 1.026 | ||||
| Ni | Control | 5.74 | 0.028 | 0.020 | 0.625 | 0.559 |
| 5.65 | 0.380 | 0.134 |
| SS | Group | Mean (wt%) | Standard deviation | Standard error | t-value | P-value |
|---|---|---|---|---|---|---|
| C | Control | 21.23 | 0.028 | 0.020 | 0.758 | 0.435 |
| 21.88 | 2.511 | 0.887 | ||||
| O | Control | 4.06 | 0.035 | 0.025 | 1.867 | 0.135 |
| 4.92 | 1.435 | 0.507 | ||||
| SI | Control | 0.34 | 0.021 | 0.015 | 0.376 | 0.718 |
| 0.32 | 0.108 | 0.041 | ||||
| Cr | Control | 14.76 | 0.077 | 0.055 | 2.952 | 0.019* |
| 14.18 | 0.537 | 0.189 | ||||
| Mn | Control | 1.01 | 0.014 | 0.010 | 2.467 | 0.042* |
| 1.20 | 0.217 | 0.076 | ||||
| Fe | Control | 52.84 | 0.077 | 0.055 | 1.626 | 0.178 |
| 50.95 | 3.290 | 1.163 | ||||
| Ni | Control | 5.74 | 0.028 | 0.020 | 0.475 | 0.649 |
| 5.65 | 0.503 | 0.177 |
The mean Chromium in the Control Group (C1) was 19.64 ± 0.643 and in the Anterior Group (C2) was 16.20 ± 2.156, and comparison between the Control (C1) and Anterior (C2) was statistically significant. The mean Iron in the Control Group (C1) was 70.67 ± 0.063 and in the Anterior Group (C2) was 58.36 ± 6.654, and comparison between the Control (C1) and Anterior (C2) was statistically significant. The mean Ni in the Control Group (C1) was 8.31 ± 0.212, and in the Anterior Group (C2) was 6.36 ± 1.088. T and comparison between the Control (C1) and Anterior (C2) were statistically significant [Table 5]. The mean Chromium in the Control Group (C1) was 19.64 ± 0.643 and in the Posterior Group (C2) was 15.99 ± 2.329, and comparison between the Control (C1) and Posterior (C2) was statistically significant. The mean Iron in the Control Group (C1) was 70.67 ± 0.063 and in the Posterior Group (C2) was 58.36 ± 6.517, and comparison between the Control (C1) and Posterior (C2) was statistically significant. The mean Ni in the Control Group (C1) was 8.31 ± 0.212 and in the Posterior Group (C2) was 6.31 ± 1.173, and comparison between the Control (C1) and Posterior (C2) was statistically significant [Table 6].
| SS | Group | Mean (wt%) | Standard deviation | Standard error | t-value | P-value |
|---|---|---|---|---|---|---|
| SI | Control | 0.40 | 0.141 | 0.100 | −0.456 | 0.708 |
| 0.45 | 0.119 | 0.045 | ||||
| Cr | Control | 19.64 | 0.643 | 0.455 | 3.876 | 0.006* |
| 16.20 | 2.156 | 0.762 | ||||
| Mn | Control | 0.97 | 0.777 | 0.550 | 0.537 | 0.681 |
| 1.23 | 0.312 | 0.109 | ||||
| Fe | Control | 70.67 | 0.063 | 0.045 | 5.222 | 0.024* |
| 58.36 | 6.654 | 2.335 | ||||
| Ni | Control | 8.31 | 0.212 | 0.150 | 4.656 | 0.002* |
| 6.36 | 1.088 | 0.321 |
| SS | Group | Mean (wt%) | Standard deviation | Standard error | t-value | P-value |
|---|---|---|---|---|---|---|
| SI | Control | 0.40 | 0.141 | 0.100 | 0.738 | 0.544 |
| 0.48 | 0.145 | 0.054 | ||||
| Cr | Control | 19.64 | 0.643 | 0.455 | 3.881 | 0.006* |
| 15.99 | 2.329 | 0.823 | ||||
| Mn | Control | 0.97 | 0.777 | 0.550 | 0.877 | 0.523 |
| 1.47 | 0.456 | 0.161 | ||||
| Fe | Control | 70.67 | 0.063 | 0.045 | 5.342 | 0.001* |
| 58.36 | 6.517 | 2.304 | ||||
| Ni | Control | 8.31 | 0.212 | 0.150 | 4.315 | 0.001* |
| 6.31 | 1.173 | 0.414 |
Microbial culture
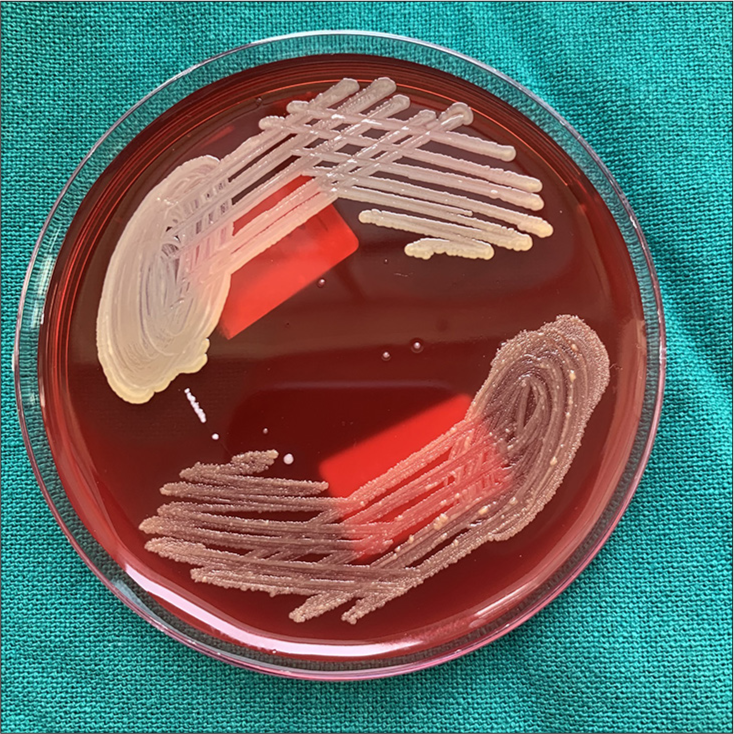
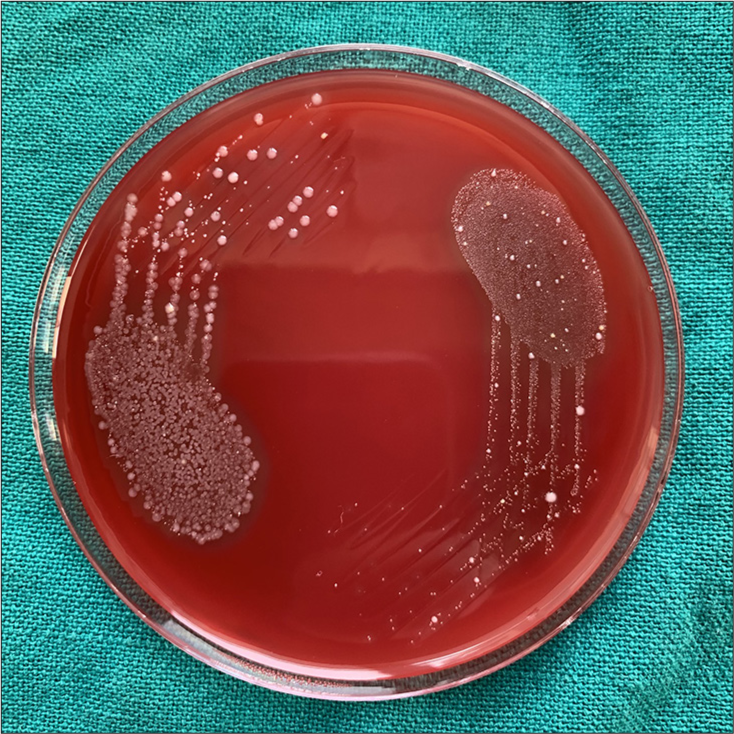
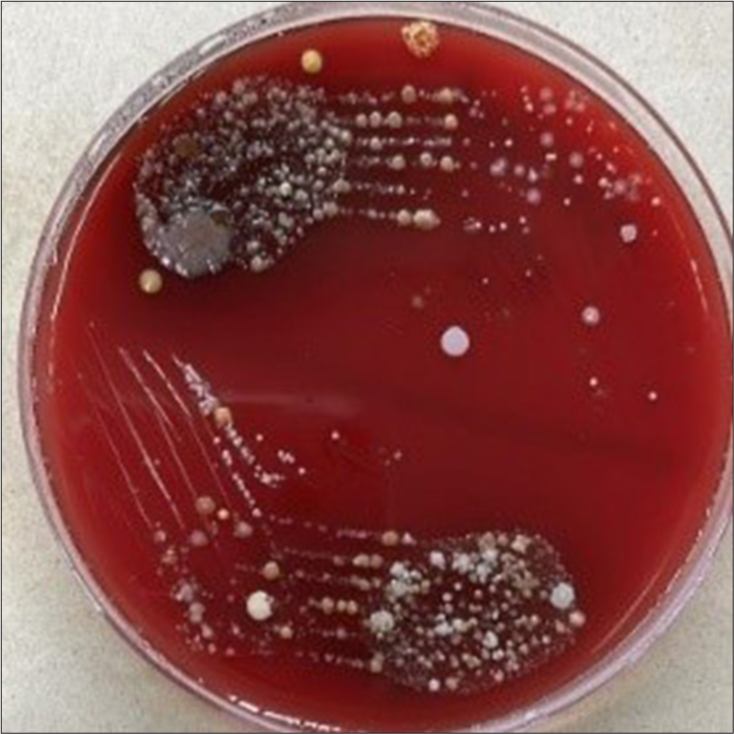
Microbial culture of all the Case Group A2 (NiTi 0.014”), B2 (SS Round 0.016”), and C2 (SS Rectangular 0.016 × 0.022”) samples was done for S. mutans, S. aureus, Lactobacilli, and C. albicans. It was found that only three samples of case Group A2 (NiTi 0.014”) showed S. aureus colony with 103 cfu/mL, 105 cfu/mL, and 103 cfu/mL [Figures 6-8]. In all the other samples of all the case Groups, no further chosen organism was found.
-
Staphlylococcus aureus with 103 cfu/ml in sample 1 of case gp A2.
-
Staphlylococcus aureus with 105 cfu/ml in sample 2 of case gp A2.
-
Staphylococcus aureus with 103 cfu/mL in sample 3 of case gp A2.
DISCUSSION
SEM evaluation
Group A (NiTi 0.014”)
Group A1 (NiTi 0.014”) control group
Under ×500 and ×1000 magnification, a scan of the unused NiTi 0.014 archwire revealed significant roughness and displayed regular, noticeable ridges and striations interspersed with voids, which may have been caused by the manufacturing process, which is similar to the study done by Babu et al. (2016).[4] According to a study on the surface topography of wires done by Lee and Chang (2001),[5] the drawing method used during manufacture is primarily the reason for the indentations observed in the wires. The NiTi wire may be more vulnerable to corrosive attack in the mouth as a result of these surface imperfections and indentations brought about by the manufacturing process.[2]
Group A2 (NiTi 0.014”) case group
Under ×500 and ×1000 magnification, a scan of the 1 month used NiTi 0.014 from the anterior and posterior segments shows deep fissures and craters were uniformly distributed across the archwire. This was similar to the study done by Eliades et al. (2004), the study that the aging effects of NiTi wires, which have been examined, are described as increasing porosity and roughness.[6] Previously, Eliades et al. (2000) also reported delamination, pitting, and crevice corrosion defects, as well as a reduction in alloy grain size in the retrieved NiTi wires after 6 months.[7]
Group B (SS round 0.016”)
Group B1 (SS round 0.016”) control group
Under ×500 and ×1000 magnification, a scan of the unused SS round 0.016” wire showed uniform prominent striations and ridges, which is similar to the study done by Daems et al. (2009). There were also a few small scratches, which may have resulted from chemical interactions during manufacture.[8]
B2 (SS round 0.016”) case group
Under ×500 and ×1000 magnification, a scan of the 1 month-used SS Round 0.016” wire showed uniformly noticeable voids and striations, as well as a large number of contaminants plugging into the wire’s surface. The results were similar to Daems et al. (2009) and Arora et al. (2019) study.[8,9]
Group C (SS rectangular 0.016 × 0.022”)
Group C1 (SS rectangular 0.016 × 0.022”) control group
Under ×500 and ×1000 magnification, a scan of the unused SS Rectangular 0.016 × 0.022” wire showed an overall smooth surface, and contaminants were discovered plugged into the wire’s surface. This might have happened during the drawing process during fabrication, which is the same as a study conducted by Babu et al.[4]
Group C2 (SS rectangular 0.016 × 0.022”) case group
Under ×500 and ×1000 magnification, a scan of the 1 month used SS Rectangular 0.016 × 0.022” wire showed multiple small ovoid areas and small craters, noticeable ridges, and striations, which is in concordance with the study done by Kim and Johnson (1999)[10] and Krishnan and Kumar (2004).[11]
EDX
Group A
In the present study, the intragroup mean weight percentage (weight%) [Table 1] of Group A1 (Control Group) versus A2 (Anterior case Group) was done, and it found that the mean weight% of Ni in Group A1 was 45.13 ± 0.14 and in Group A2 was 27.04 ± 18.89, respectively, which was found to be statistically significant (P = 0.030).
Similarly, intragroup mean weight percentage (weight%) [Table 2] of Group A1 (Control Group) versus A2 (Posterior case Group) was done, and it found that the mean weight% of Ni in Group A1 was 45.13 ± 0.14 and in Group A2 was 27.07 ± 18.84, respectively, which was found to be statistically significant (P = 0.030). Hence, according to the study done, it was found that there was increased Carbon, decreased Titanium, and statistically decreased Ni content in the NiTi archwire.
The increased Carbon content in the archwire can lead to increased hardness of the archwire, decreased Ni leads to change in properties which affect the archwire’s strength and flexibility over time, and it might also lead to Ni allergy, which triggers an immune response leading to irritation, swelling, and discomfort in the mouth. Therefore, it was observed that Ni from the NiTi wire leaches out after 1 month of insertion in the oral cavity, which may be due to the harsh oral environment. This is similar to the study done by Toker and Canadinc (2014).[12] Dos Santos et al. (2015) discovered that the carbon content of SS and NiTi archwires increases proportionately with intraoral time.[13]
Group B
In the present study, the intragroup mean weight percentage (weight%) [Table 4] of Group B1 (Control Group) versus B2 (Anterior case Group) was done, and it found that the mean weight% of Chromium (Cr) in Group B1 was 14.76 ± 0.077 and in Group B2 was 14.13 ± 0.741, respectively, which was found to be statistically significant (P = 0.049). When the Manganese (Mn) of Group B1 (Control Group) versus B2 (Anterior case Group) was done, it was found that the mean weight% of Manganese (Mn) in Group A1 was 0.1.01 ± 0.014 and in Group A2 was 1.19 ± 0.216, respectively, which was found to be statistically significant (P = 0.049). When the Iron (Fe) of Group B1 (Control Group) versus B2 (Anterior case Group) was done, it was found that the mean weight% of Iron (Fe) in Group A1 was 52.84 ± 0.77 and in Group A2 was 50.41 ± 2.904, respectively, which was found to be statistically significant (P = 0.050).
Similarly, intragroup mean weight percentage (weight%) [Table 5] of Group B1 (Control Group) versus B2 (Posterior case Group) was done, and it found that the mean weight% of Chromium (Cr) in Group B1 was 14.76 ± 0.077 and in Group B2 was 14.18 ± 0.537, respectively, which was found to be statistically significant (P = 0.019). When the Manganese (Mn) of Group B1 (Control Group) versus B2 (Posterior case Group) was done, it was found that the mean weight% of Manganese (Mn) in Group A1 was 0.1.01 ± 0.014 and in Group A2 was 1.20 ± 0.217, respectively, which was found to be statistically significant (P = 0.042).
The significant reduction of chromium in the archwire would weaken the metal’s strength, corrosion resistance, and biocompatibility, as well as increase the archwire’s susceptibility to rust and breaking. These results also show a significant decrease in Iron (Fe) from the SS archwires after 1 month of usage in the oral cavity, which can lead to reduced hardness of the SS archwire. Manganese ions are among the several electrolytes found in saliva and other oral secretions. These ions may interact with the surface of the wire during use, leading to a certain amount of deposition. The increase in oxygen content shows wire oxidation which will further increase the corrosion of the archwire. The study of our results was similar to a study done by Kararia et al. (2015) in which wires were subjected to complexometric titration.[14]
Group C
In the present study, the intragroup mean weight percentage (weight%) [Tables 5] of Group C1 (Control Group) versus C2 (Anterior case Group) was done, and it found that the mean weight% of Chromium (Cr) in Group B1 was 19.64 ± 0.64 and in Group B2 was 16.20 ± 2.15, respectively, which was found statistically significant (P = 0.006). When the Iron (Fe) of Group B1 (Control Group) versus B2 (Anterior case Group) was done, it found that the mean weight% of Iron (Fe) in Group B1 was 70.67 ± 0.063 and in Group B2 was 58.36 ± 6.65, respectively, which was found to be statistically significant (P = 0.024). When the Ni of Group B1 (Control Group) versus B2 (Anterior case Group) was done, it was found that the mean weight% of Ni in Group A1 was 8.31 ± 0.21 and in Group A2 was 6.36 ± 1.08, respectively, which was found to be statistically significant (P = 0.002).
Similarly, the intragroup mean weight percentage (weight%) [Tables 6] of Group C1 (Control Group) versus C2 (posterior case Group) was done, and it found that the mean weight% of Chromium (Cr) in Group B1 was 19.64 ± 0.64 and in Group B2 was 15.99 ± 2.32, respectively, which was found statistically significant (P = 0.006). When the Iron (Fe) of Group B1 (Control Group) versus B2 (Posterior case Group) was done, it found that the mean weight% of Iron (Fe) in Group B1 was 70.67 ± 0.063 and in Group B2 was 58.36 ± 6.65, respectively, which was found to be statistically significant (P = 0.001). When the Ni of Group B1 (Control Group) versus B2 (posterior case Group) was done, it was found that the mean weight% of Ni in Group A1 was 8.31 ± 0.21 and in Group A2 was 6.31 ± 1.17, respectively, which was found to be statistically significant (P = 0.001).
The reduction in chromium in the archwire would weaken the metal’s strength, corrosion resistance, and biocompatibility, as well as increase the archwire’s susceptibility to rust and breaking. Iron leaches out, reducing the hardness of the SS.
These results were similar to the study where it was discovered that a significant quantity of metals was leaking from the SS wire. The results indicated that a comparatively considerable quantity of chromium had leached out of the wire in just 4 weeks, indicating that the breakdown of the chromium passivating layer is the primary cause of corrosion in SS.
There was a significant decrease in the iron content of retrieved SS wires in this study. This decrease was also seen in studies by Mikulewicz et al. (2014)[15] who suggested the solubilization of iron due to corrosion, and Dos Santos et al. (2015)[13]
All the wire Niti (0.014), SS Round (0.016), and SS Rectangular (0.016 × 0.022”), which were used for 1 month intraorally underwent significant surface changes which were seen in SEM and EDX, that changed the overall property of archwire, has increased their susceptibility to corrosion and has decreased their potential to withstand the fracture. This will decrease the performance of the archwire. In addition, this might affect desired tooth movement.
Therefore, it is of utmost importance to comprehend how archwires age intraorally and to use them under clinical efficacy; it would be preferable to replace the archwire after using 1 month intraorally in conditions where extended leveling and alignment are necessary.
Microbial culture
Microbial culture for all the samples was done for S. mutans, S. Aureus, Lactobacilli, and C. albicans in Group A2 (NiTi 0.014”), B2 (SS Round 0.016”), and C2 (SS Rectangular 0.016 × 0.022”). The growth of these micro-organisms was observed and quantified by colony-forming units. S. mutans and Lactobacilli were studied because of their well-documented role in the initiation and progression of dental caries.[3] S. aureus was studied as it has been associated with dentoalveolar infections and oral mucosal lesions.[16] C. albicans is the most common Candida species isolated in orthodontic patients. It produces biofilm on dental surfaces and co-aggregates with other oral bacteria.[17]
It was found that only three samples of case Group A2 (NiTi 0.014”) showed a S. aureus colony. In all the other samples of all the case Group, no further chosen organism was found. Periodontal infections and dental cavities can be caused by oral bacteria that have a favorable habitat in orthodontic archwires. S. aureus has been linked to dentoalveolar infections and oral mucosal lesions in the oral cavity. It has also been shown to colonize mucosal surfaces, tongue, saliva, periodontal pocket, and supragingival tooth surfaces.[18]
In our study, we found S. aureus, but the results are non-significant, which is similar to the study done by Fritschi et al. (2008). They found that S. aureus was found at a high prevalence in non-smoking individuals with aggressive periodontitis.[19]
In our study, we found S. aureus only in NiTi wire, which is in line with the findings of a study by Eliades et al. (2000), which concluded that S. aureus had a high affinity for titanium surfaces because of a change in the composition of surface NiTi archwires following intraoral exposure for 1–6 months, caused by the occurrence of amorphous precipitates and microcrystalline particles in proteinaceous biofilm.[7]
Overall, the lack of significant results presents an opportunity to refine and improve the research approach, leading to a deeper understanding of the factors influencing bacterial and fungal growth. In future studies, it is important to refine the experimental design to address any limitations or factors that may have influenced the results. This could involve adjusting variables, increasing sample sizes, controlling environmental conditions more rigorously, or utilizing different methodologies to better isolate the effects being studied. This allows for a more focused investigation into the specific factors influencing growth for each organism and can provide more precise results.
CONCLUSION
This study aimed to evaluate the surface changes, composition changes, and microbial adhesion on orthodontic archwires during fixed appliance therapy. Surface and composition changes of SS and NiTi orthodontic archwires before and during the treatment were assessed using SEM – EDX microscopy. Microbial adhesion on the orthodontic archwires was also evaluated and compared. The following conclusions were drawn:
Surface roughness of NiTi and SS archwire increases with the usage.
NiTi archwire composition alters with usage in an oral environment in which a significant decrease in Ni content can affect properties of flexibility and strength; it might also lead to Ni allergy, which triggers an immune response.
SS archwire composition also changes with the usage in which a significant decrease in Iron (Fe) and Chromium (Cr) content can lead to reduced hardness, strength, corrosion resistance, and biocompatibility, respectively, which further increase the archwire’s susceptibility to rust and breakage.
The Anterior and posterior segments of the NiTi and SS, on comparison, show similar changes in surface and composition.
Microbial culture of the NiTi and SS show no significant growth of Streptococcus mutants, Lactobacilli, and C. albicans.
S. aureus culture was found in 3 cases of NiTi archwire but does not correlate with the surface roughness or the composition of the archwire.
In the present study, wires were evaluated only after 1 month of usage, which exhibits considerable changes in surface property and composition. Hence, it can be assumed that if the same wire is used for an extended period, the surface roughness and composition may change even more. Hence, it is advisable to change the NiTi and SS archwire on a regular schedule to prevent property alteration and derive outcomes. There were no noticeable findings in the microbiological investigation; however, S. aureus was detected in a few cases of NiTi archwire, suggesting that further studies are required to examine the microorganism growth and its correlation with archwire properties. Further research is also needed to determine the change in surface property and composition following use for an extended duration of time.
Ethical approval
The research/study was approved by the Institutional Review Board at SGT University, Haryana, number FODS/EC/ORTHO/2022/06, dated April 06, 2022.
Declaration of patient consent
The authors certify that they have obtained all appropriate patient consent.
Conflicts of interest
There are no conflicts of interest.
Use of artificial intelligence (AI)-assisted technology for manuscript preparation
The authors confirm that there was no use of artificial intelligence (AI)-assisted technology for assisting in the writing or editing of the manuscript and no images were manipulated using AI.
Financial support and sponsorship: Nil.
References
- Variations in surface roughness of seven orthodontic archwires: An SEM-profilometry study. Korean J Orthod. 2012;42:129-37.
- [CrossRef] [PubMed] [Google Scholar]
- Scanning electron microscopy (SEM) and energy-dispersive X-ray (EDX) spectroscopy In: Membrane characterization. Netherlands: Elsevier; 2017. p. :161-79.
- [CrossRef] [Google Scholar]
- Ligature wires and elastomeric rings: Two methods of ligation, and their association with microbial colonization of Streptococcus mutans and lactobacilli. Eur J Orthod. 1991;13:416-20.
- [CrossRef] [PubMed] [Google Scholar]
- Evaluating the surface characteristics of stainless steel, TMA, timolium, and titanium-niobium wires: An in vivo scanning electron microscope study. J Contemp Dent Pract. 2016;17:372-6.
- [CrossRef] [PubMed] [Google Scholar]
- Effects of recycling on the mechanical properties and the surface topography of nickel-titanium alloy wires. Am J Orthod Dentofacial Orthop. 2001;120:654-63.
- [CrossRef] [PubMed] [Google Scholar]
- Characterization and cytotoxicity of ions released from stainless steel and nickel-titanium orthodontic alloys. Am J Orthod Dentofacial Orthop. 2004;125:24-9.
- [CrossRef] [PubMed] [Google Scholar]
- Surface characterization of retrieved NiTi orthodontic archwires. Eur J Orthod. 2000;22:317-26.
- [CrossRef] [PubMed] [Google Scholar]
- Morphological characterization of as-received and in vivo orthodontic stainless steel archwires. Eur J Orthod. 2009;31:260-5.
- [CrossRef] [PubMed] [Google Scholar]
- Surface topography and composition of as-received and-retrieved initial archwires: A comparative study. World J Dent. 2019;10:144-9.
- [CrossRef] [Google Scholar]
- Corrosion of stainless steel, nickel-titanium, coated nickel-titanium, and titanium orthodontic wires. Angle Orthod. 1999;69:39-44.
- [Google Scholar]
- Mechanical properties and surface characteristics of three archwire alloys. Angle Orthod. 2004;74:825-31.
- [Google Scholar]
- Evaluation of the biocompatibility of NiTi dental wires: A comparison of laboratory experiments and clinical conditions. Mater Sci Eng C Mater Biol Appl. 2014;40:142-7.
- [CrossRef] [PubMed] [Google Scholar]
- Effect of time and pH on physical-chemical properties of orthodontic brackets and wires. Angle Orthod. 2015;85:298-304.
- [CrossRef] [PubMed] [Google Scholar]
- Estimation of changes in nickel and chromium content in nickel-titanium and stainless steel orthodontic wires used during orthodontic treatment: An analytical and scanning electron microscopic study. Contemp Clin Dent. 2015;6:44-50.
- [CrossRef] [PubMed] [Google Scholar]
- Mapping chemical elements on the surface of orthodontic appliance by SEMEDX. Med Sci Monit. 2014;20:860-5.
- [CrossRef] [PubMed] [Google Scholar]
- Staphylococcus aureus (including toxic shock syndrome) In: Mandell GL, Bennett JE, Dolin R, eds. Principles and practices of infectious diseases (4th ed). Philadelphia, PA: Churchill Livingstone Elsevier; 1995. p. :1754-5.
- [Google Scholar]
- Fungi in endodontic infections. Oral Surg Oral Med Oral Pathol Oral Radiol Endod. 2004;97:632-41.
- [CrossRef] [Google Scholar]
- Staphylococcus aureus (including Staphylococcal toxic shock) In: Mandell GL, Bennett JE, Dolin R, eds. Principles and practice of infectious diseases. Philadelphia, PA: Churchill Livingstone; 2000. p. :2069-92.
- [Google Scholar]
- Staphylococcus aureus and other bacteria in untreated periodontitis. J Dent Res. 2008;87:589-93.
- [CrossRef] [PubMed] [Google Scholar]


