

Translate this page into:
Three-dimensional evaluation of condylar position in skeletal Class I and Class II malocclusions along with vertical facial morphology

*Corresponding author: Aditi Sharma, Department of Orthodontics and Dentofacial Orthopaedics, Bangalore Institute of Dental Sciences, Bengaluru, Karnataka, India. aditi230388@gmail.com
-
Received: ,
Accepted: ,
How to cite this article: Sharma A, Pai V, Hegde M, Rajaram S. Three-dimensional evaluation of condylar position in skeletal Class I and Class II malocclusions along with vertical facial morphology. APOS Trends Orthod 2022;12:236-44.
Abstract
Objectives:
This study aimed to three-dimensionally evaluate and compare anatomic condylar position to glenoid fossa in skeletal Classes I and II malocclusions along with vertical facial morphology (VFM).
Material and Methods:
Full skull 50 cone-beam computed tomographies (CBCTs) were taken with teeth in maximum intercuspation of patients aged 18–45 years who were grouped as skeletal Classes I and II, 25 each based on ANB angle and the patient’s right condyle was analyzed on CareStream-3D viewing software. The VFM was categorized based on the Jarabak ratio. Statistical analysis was performed using Mann–Whitney and Chi-square test.
Results:
In skeletal Class II when compared to Class I, the condyle in the glenoid fossa was anteriorly positioned with reduced anterior (P = 0.006) and increased posterior (P = 0.04) distance showing eccentric position. The condyle was also positioned lower suggesting an increased distance in the upper joint space (P = 0.04). The reduced height of the articular eminence indicated the condylar path and its position. The angle of articular eminence (P = 0.44) was decreased. Statistically, significant difference was not found between the various vertical facial morphologies.
Conclusion:
CBCT provides precise diagnostic values of joint spaces in skeletal Classes I and II to differentiate ideal condylar position from non-ideal according to different skeletal patterns, VFM, and also to notice minor discrepancies in joint spaces quantitatively. Depending on increased or decreased distances in the joint spaces, one can identify any temporomandibular joint-related discrepancies.
Keywords
Cone-beam computed tomography
Condylar position
Glenoid fossa
Temporomandibular disorder
Vertical facial morphology

INTRODUCTION
In recent years, orthodontists are aiming at achieving a musculoskeletal stable position[1] where the condyle should be seated in an upward and forward position when the teeth are in complete intercuspation. This seated condylar position has been referred to as centric relation and has become a desirable goal for a growing number of orthodontists.
Condylar position and morphology are important features for temporomandibular joint (TMJ)-oriented orthodontic diagnosis and treatment planning[2] and vary greatly in different skeletal groups and vertical facial morphologies which might be due to developmental variability or condylar remodeling.
It is also influenced by many dynamic variables[2] such as age, sex, increased or decreased masticatory force, functional matrix activities, occlusion changes, physiological adaptations, and facial growth patterns.
An optimal ideal position of the mandibular condyle in the glenoid fossa is a fundamental question in dentistry and a factor in diagnosing temporomandibular disorder (TMD) when the teeth are in maximum intercuspation.[3] Although occlusion can be observed clinically in the mouth, there are no quantitative standards to analyze the position of the condyle in the glenoid fossa in adults with different sagittal and vertical discrepancies.
Cone-beam computed tomography (CBCT), a 3D imaging modality, provides multiplanar images that allow accurate assessment and measurement of joint spaces of the condylar position within the glenoid fossa,[4,5] providing isotropic sub-millimeter spatial resolution, and images of higher diagnostic quality with a three-dimensional representation of the maxillofacial hard tissues with minimal distortion.
The study is carried out on healthy TMJs, we presumed that both the right and the left sides of the condyle will be equal. According to the previous studies,[6-9] the concentric position of the condyles on the right and left sides in their respective mandibular fossae showed no significant difference between its right and left sides in all three planes irrespective of the type of malocclusion present thus, only the right side for the measurements.
Several studies have emphasized the importance of condylar shape and volume for long-term stability after orthodontic treatment. However, little is known about the spatial relationship between the skeletal pattern and condylar position concerning the glenoid fossa. Despite the availability of many CBCT views of the TMJ, there is no quantitative standard for the optimal position of the mandibular condyle in the glenoid fossa in our population. Knowledge of the spatial variations of the normal condyle-fossa relationship will allow the clinician to potentially identify the beginning of the degenerative joint disease or indicate problems already established, as well as helps in better diagnosis and treatment planning[2] prior orthodontic treatment for the long-term stability of joint.
MATERIAL AND METHODS
This study was designed to three-dimensionally evaluate the condylar position in sagittal skeletal Class I and skeletal Class II malocclusions using CBCT along with vertical facial growth morphology.
Ethical clearance was obtained before the start of study from the Ethical Clearance Committee.
Functional examination was carried out on all patients. Patients with TMD symptoms and dual bite were excluded from the study.
The details of the study were explained and an informed consent was taken from the patients willing to participate in the study.
The sample size was estimated using the G Power software v. 3.1.9.2 (Franz Faul, Universität Kiel, Germany). Considering the effect size to be measured (d) at 72%, power of the study at 80% and with the two-sided level of significance, that is, the alpha error at 10%, the sample size obtained is 50. Each study group comprised 25 samples (25 samples × 2 groups = 50 samples).
Based on the availability of cases, 50 CBCTs scans of the full skull with teeth in maximum intercuspation (centric occlusion) which fulfill the inclusion criteria were selected for the study. Based on the ANB angle, these were divided into two groups using cephalometric radiographs
GROUP I = 25 (Skeletal Class I; ANB angle = (2–4°)
GROUP II = 25 (Skeletal Class II; ANB angle = >4°), aged between 18 and 45 years
Inclusion criteria
The following criteria were included in the study:
Patients aged between 18 and 45 years
Good health condition
No oral or systemic pathology
Patients having a full complement of permanent dentition
CBCT images at maximum occlusal intercuspation.
Exclusion criteria
The following criteria were excluded from the study:
History of the previous orthodontic treatment
Congenital craniofacial or TMJ deformities, including condylar hyperplasia or condylar ankylosis
History of degenerative joint disease
Mutilated malocclusion or clinically missing teeth.
Once CBCT scans were obtained, the 3-D constructed images were oriented along the Frankfurt horizontal plane, parallel to the floor, and perpendicular to the mid-sagittal plane using CareStream-3D imaging software (CS-3D) [Figure 1].

- The scans were aligned parallel to Frankfurt’s horizontal plane.
The vertical facial morphology (VFM) or pattern was determined by measuring Nasion to Menton divided by Sella to Gonion [Figure 2].

- Nasion-Menton/Sella-Gonion.
CS-3D imaging software was used to locate the patient’s right condyle in the axial view [Figure 3] and this was then evaluated in the sagittal plane [Figures 4 and 5].

- Sagittal view is set at 1.5 mm.

- Axial view was used to locate the right condyle.

- Sagittal view of the right condyle integration to view right condyle and measure the five reference landmarks.
Once the sagittal view was set, image was set at 1.5 mm integration [Figure 3] to measure 5 reference landmarks proposed by Ricketts to measure joint spaces [Figure 6, Table 1].
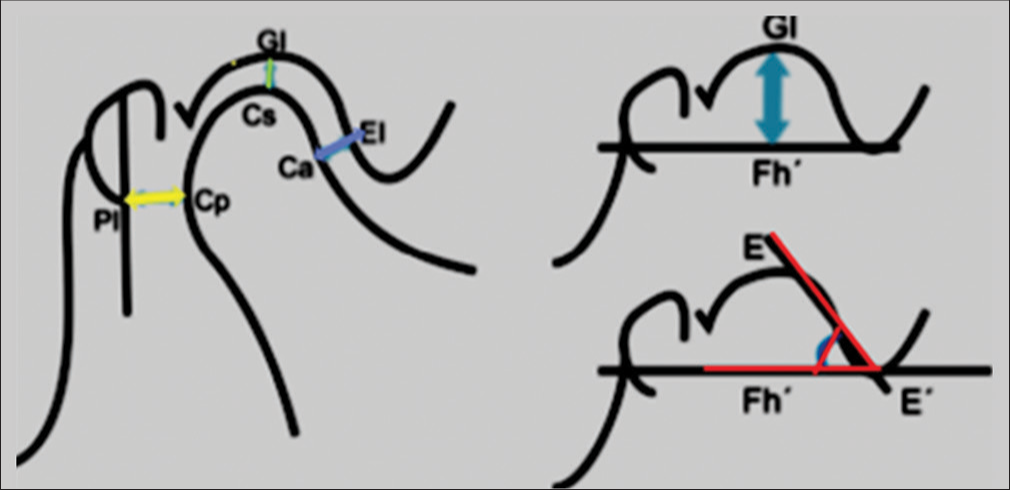
- Landmarks established for the analysis of condyle position (Ricketts).
| Cs | The highest point of the condyle in the sagittal view |
| GI | Point of greatest concavity of the glenoid fossa |
| Cp | Most convex points on the posterior face of the condyle |
| PI | Line perpendicular to the Frankfurt plane passing through the mid-point of the sagittal diameter of the external auditory canal. |
| Ca | Point on the anterior wall of the condyle closest to the posterior wall of the articular eminence. |
| EI | Point on the posterior wall of the articular eminence closest to the anterior wall of the condyle |
| E-E´ | Line tangential to the posterior wall of the articular eminence |
| Fh´ | Line parallel to Frankfurt plane passing through the lower edge of the articular eminence. |
Anatomical landmarks used for the measurement of condyle position concerning mandibular fossa [Figure 6]
Upper Distance (Cs-GI) – from the highest point of the condyle to the deepest part of the glenoid fossa.
Posterior Distance (Cp-PI) – from the most convex part of the posterior wall of the condyle to the line PI.
Anterior Distance (Ca-EI) – joining the most convex point on the anterior wall of the condyle with point EI.
Angle of Eminence (EE'-Fh') – angle between the tangent passing through the posterior wall of the articular eminence and the Fh´ plane parallel to the Frankfurt plane.
Height of Eminence (GI-Fh) – from the deepest part of the glenoid fossa to the Fh´ plane parallel to the Frankfurt plane.
The position of the condyle in the glenoid fossa varies according to VFM along with different sagittal skeletal patterns. In this study, subjects with skeletal Class I and skeletal Class II malocclusion were divided into three groups: Hypodivergent as in horizontal growth pattern (HGP), mormodivergent as in average growth pattern (AGP), and hyperdivergent as in vertical growth pattern (VGP) based on Jarabak ratio (JR) or facial height ratio.
The JR was then calculated by dividing posterior facial height (S-Go) by anterior facial height (N-Me)/100.
| Jarabak ratio (JR) | Vertical facial morphology |
|---|---|
| <0.62 | Hyperdivergent |
| >0.65 | Hypodivergent |
| 0.62–0.65 | Normodivergent |
Statistical analysis
All the data were subjected to statistical analysis using descriptive statistics such as mean, standard deviation, and percentages that were calculated.
Inferential statistics such as repeated measures Mann–Whitney test were used to compare the mean ANB angle, age, and different linear and angular parameters measuring the condylar position in the glenoid fossa between the two groups.
Chi-square test was used to differentiate between gender.
RESULTS
Table 2, Graphs 1 and 2 depict the mean values of the various linear and angular parameters measuring the condylar position concerning the glenoid fossa in skeletal Class I and skeletal Class II, respectively, using the Mann–Whitney test.
| Parameters | Group | N | Mean | SD | Mean Diff | P-value | INFERENCE | |
|---|---|---|---|---|---|---|---|---|
| Upper Distance (mm) | Skeletal Class I | 25 | 2.76 | 0.96 | −0.50 | 0.04* | Lesser | |
| Skeletal Class II | 25 | 3.26 | 1.08 | Greater | Lower positioned condyle | |||
| Anterior Distance (mm) | Skeletal Class I | 25 | 2.61 | 0.73 | 0.53 | 0.006* | Greater | |
| Skeletal Class II | 25 | 2.08 | 0.49 | Lesser | Anteriorly positioned condyle | |||
| Posterior Distance (mm) | Skeletal Class I | 25 | 6.32 | 1.58 | −1.02 | 0.04* | Lesser | |
| Skeletal Class II | 25 | 7.34 | 2.07 | Greater | Posteriorly positioned condyle | |||
| Height of eminence (mm) | Skeletal Class I | 25 | 8.35 | 1.25 | 1.24 | 0.01* | Lesser | |
| Skeletal Class II | 25 | 7.11 | 1.76 | Greater | Condylar path and position | |||
| Angle of articular eminence (°) | Skeletal Class I | 25 | 50.80 | 2.80 | 1.00 | 0.44 | Greater | |
| Skeletal Class II | 25 | 49.80 | 3.58 | Lesser | Flat articular eminence | |||
| No statistically significant difference | ||||||||
| S-Go | Skeletal Class I | 25 | 76.38 | 10.28 | 2.10 | 0.42 | Greater | No statistically significant difference |
| Skeletal Class II | 25 | 74.28 | 7.98 | Lesser | ||||
| N-Me | Skeletal Class I | 25 | 109.96 | 5.50 | −0.65 | 0.92 | Lesser | No statistically significant difference |
| Skeletal Class II | 25 | 110.61 | 7.28 | Greater | ||||
| S-Go/N-Me (mean) | Skeletal Class I | 25 | 0.66 | 0.16 | −0.01 | 0.67 | Lesser | No statistically significant difference |
| Skeletal Class II | 25 | 0.67 | 0.06 | Greater | ||||
| *Statistically significant |
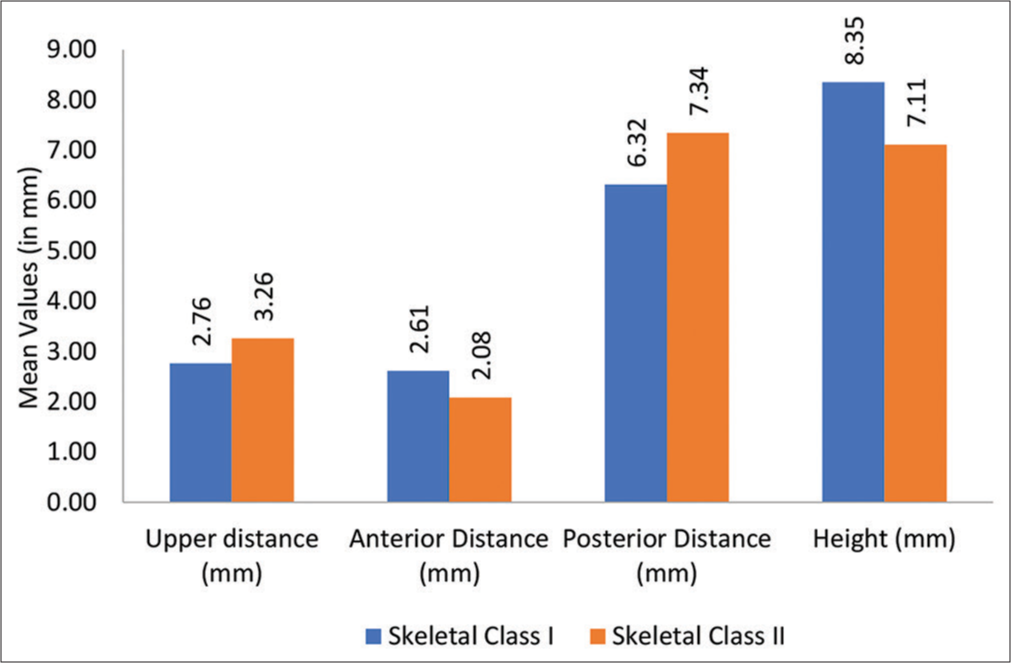
- Mean values of different linear study parameters measuring the condylar position between two groups.
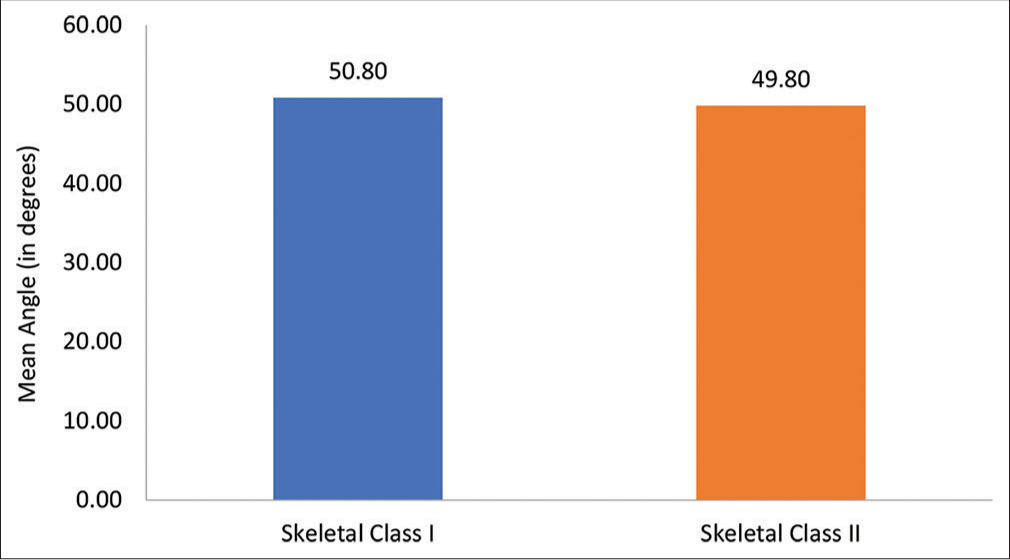
- Mean angle of articular eminence (in degrees) between two groups.
[Table 3 and Graph 3] depict the vertical facial growth pattern determined by JR between the two groups: Skeletal Class I and skeletal Class II using Mann–Whitney test (P = 0.28) and Chi-square test (P = 0.18).
| Growth Pattern | Skeletal Class I | Skeletal Class II | P-value | ||
|---|---|---|---|---|---|
| n | % | n | % | ||
| Hyperdivergent (HGP) | 6 | 24% | 4 | 16% | 0.18 |
| Normodivergent (AGP) | 0 | 0% | 3 | 12% | |
| Hypodivergent (VGP) | 19 | 76% | 18 | 72% | |

- Vertical facial growth pattern determined by Jarabak ratio between two groups.
The Chi-square test was used to compare the percentage of hyperdivergent or VGP, hypodivergent or HGP, and normodivergent.
No statistically significant difference was observed between the skeletal Class I and skeletal Class II groups (P = 0.18).
[Graph 4] depicts the mean anterior and posterior facial heights (VFM) in skeletal Class 1 and skeletal Class II groups.

- Mean values of S-Go and N-Me between two groups.
DISCUSSION
The optimum condylar position (centric relationship) is the uppermost and middlemost location facing the articular eminence which coincides with the maximum intercuspation of teeth in an ideal state[3] The condylar head is usually harmonious and concentric with the glenoid fossa and its position can be determined by the dimension of the joint space.
CBCT is an advanced technique that provides multiple images[10] with high resolution and low radiation dose compared to computed tomography (CT) and can visualize TMJ anatomy and its associated structures without any distortion and superimposition.[6,11]
This facilitates the analysis of joint spaces accurately and precisely in all planes (axial, sagittal, and coronal planes) and is considered to be a reliable tool for linear and angular measurements and to assess the position of the condyle in the glenoid fossa. Any asymmetry in the condylar position quantitatively reveals the disorder.
Suomalainen et al.[12] found that the accuracy of assessing linear measurements was greater and also the errors are less in CBCT than in CT, confirming the accuracy of our selective method for linear measurements.
Therefore, knowledge about precise and accurate diagnostic linear values in skeletal Class I and skeletal Class II malocclusion patterns will help a clinician in avoiding the progression of further TMJ problems associated with diagnosis, treatment planning, and long-term stability after orthodontic treatment.
In this study, the ANB angle was used to classify subjects into two skeletal groups: Skeletal Class I (2–4°) and skeletal
Class II (>4°). Despite its shortcomings, the ANB angle is one of the most reliable tools and is routinely used to differentiate sagittal skeletal patterns.[13,14]
Oktay[15] concluded that the ANB angle was not less reliable than any other cephalometric method as a sagittal anteroposterior parameter. Thus, the ANB angle was taken as a standard tool that is known to all clinicians and easy to apply in routine practice.
In the present study, five Ricketts parameters were used to assess condylar position in the glenoid fossa in skeletal Class I and skeletal Class II malocclusions, respectively.
The mean upper distance was found to be higher in skeletal Class II when compared to skeletal Class I. The mean upper distance in males and females individually was found to be higher in skeletal Class II as well. This shows that the condylar position is lower in skeletal Class II.
Ricketts[9] using cephalometric laminography gained similar results where the upper distance was increased in skeletal Class II showed a lower positioned condyle.
On the contrary, Arieta-Miranda et al.[16] found that the condyles in skeletal Class II are more superiorly placed when compared with skeletal Class I. This can be due to the difference in the sample used, different facial growth patterns in a different race, etc.
This increase or decrease[17] in the upper distance may produce pathologies such as resorption and condylar hypoplasia thus showing if the condyle has been morphologically altered.
The mean anterior distance was found to be lesser in skeletal Class II when compared to skeletal Class I. The mean anterior distance in males and females individually was found to be less in skeletal Class II as well. This shows that the condyle is positioned more anteriorly in skeletal Class II as compared to skeletal Class I.
Pullinger and Hollender[17] showed non-concentric position as a characteristic of Class II malocclusion and condyles are positioned anteriorly in Class II when compared with Class I.
In contrast to our results, few researchers[18,19] found more posteriorly positioned condyles in Class II groups. The disparity among the results between authors may be due to differences in age group, sample used in the study, race, ethnic background, and different methods for measuring condylar position that can affect the condylar position and its morphology.
The mean posterior distance was found to be higher in skeletal Class II when compared to skeletal Class I. The mean posterior distance in males and females individually was found to be more in skeletal Class II as well. This shows that the condyle is positioned more anteriorly in skeletal Class II as compared to skeletal Class I. No significant sex differences were noted in joint space dimensions.
Ricketts[9] in his analysis of variations in condyle position concluded that in Class II malocclusions the condyle appears to be more anteriorly positioned.
This present study also showed similar results as the condyles are positioned more anteriorly in skeletal Class II when compared to skeletal Class I similar to the study done by Arieta-Miranda et al.[16]
The difference might have been due to the use of different equipment, a different method used, and different samples.
The mean articular eminence angle was found to be lesser (49.80°) in skeletal Class II and higher (50.80°) in skeletal Class I. The mean angle in males (49.69°) and females (50°) individually was found to be less in skeletal Class II compared to skeletal Class I, in males (50.83°) and females (50.71°).
The normal value of this angle in adults has been reported to be 30–60°[20] and it varies among individuals. Values smaller than 30° have been characterized as flat, whereas those having values >60° have been characterized as steep. Articular eminence inclination: Flatness or steepness dictates the path of the condyle movement, as well as the degree of rotation of the articular disc. It has been suggested that a steep articular eminence predisposes to disk interference problems.
According to Lobo et al.,[21] normal AEI value in adults is in between 39.25° and 55.42°. Nickel et al. reported the value in adults to be 45°.
Conversely, this result appears to be significantly different as described by Arieta-Miranda et al.[16] The AEI mean value observed in each of the skeletal classes was different from the ones reported by Arieta-Miranda et al.[16] The articular angle was higher in the Class I group (58°), decreased to (51°) in Class II and was even lower in the Class III group (42°).
However, the present study showed very little difference within the skeletal Class I and skeletal Class II groups with mean values of 50.80◦ and 49.80◦, respectively, and showed no statistical significance.
Lobo et al.[21] found no significant difference between skeletal Classes I and II, confirming the results of this study. Moreover, the vast majority of studies failed in demonstrating a clear relationship between the AE angle and the severity of TMDs using CBCT.[22] AEI could also be influenced by degenerative bone diseases and by the shape of the mandibular condyle.
Knowledge about articular eminence is considered to be very important, as this will help in establishing and applying more biological therapeutic orthodontic modalities.
The mean height of articular eminence was found to be higher in skeletal Class I when compared to skeletal Class II. The mean height of articular eminence in males and females individually was found to be more in skeletal Class I as well.
The lesser value in skeletal Class II suggested reduced eminence height indicating the condylar path and its position in the glenoid fossa.
Vitral et al.[23] did not find any significant differences in the height of the glenoid fossa between the Class I and Class II groups. On the contrary, other studies[9,24,25] showed significant differences with higher values in Skeletal Class I compared to skeletal Class II.
No correlation was observed between the height of the eminence and the different skeletal malocclusions. This finding may be due to the influence of difference in the approach to measurement by researcher, sample size, difference in growth patterns, and severity of the skeletal relationship.
Lobo et al.[21] observed the eminence height and reported that sex had a significant effect. The values for males were higher though the skeletal patterns were not considered. This is similar to our findings where males showed more eminence height.
Several studies[26,27] attempted to assess whether vertical and sagittal malocclusions influence TMJ structures. However, the outcomes of these studies remain discordant.
This study also evaluated the VFM as one more important parameter concerning condylar position based on JR. About 76% of hypodivergent, 24% of hyperdivergent with no normodivergent with skeletal Class I malocclusion; 72% of hypodivergent, 12% of normodivergent, and 16% of hyperdivergent with skeletal Class II malocclusion participated in this study.
In general, hypodivergent was observed more in this study followed by hyperdivergent and normodivergent. The results were inconclusive as there was no statistical difference observed between the two groups concerning vertical facial growth patterns (P = 0.18).
Park et al.[2] conducted a study on a patient with different skeletal vertical patterns to evaluate the condylar position. They concluded that condylar position and morphology vary according to VFM.
The vertical skeletal pattern has a greater influence on the TMJ than the sagittal skeletal type[2,26] and this is important in establishing proper treatment for TMD.
Concerning the upper distance, the condyle-fossa relationship varies in sagittal and vertical skeletal patterns in several studies.[17,26]
Burke et al.[28] evaluated the correlation between condylar characteristics and facial morphology in Class II preadolescent patients by lateral cephalometry. They found that patients with vertical facial morphologic characteristics showed decreased superior joint spaces.
Chae et al.[29] evaluated the condyle-fossa relationship in adolescents with various skeletal patterns using CBCT and demonstrated that there were only some differences observed as condyles were positioned inferiorly in hypodivergents compared to hyperdivergents in skeletal Class II pattern as the upper distance was greater in the joint space.
The previous studies[2,16,24,28] also showed similar results and found no correlation between vertical facial skeletal patterns and sagittal skeletal patterns. The results were consistent with the present study as well, no statistical significance was found in relation to skeletal Class I and skeletal Class II.
In this study, condyle is positioned more anteriorly in the skeletal Class II when compared to skeletal Class I as most of the participants were of HGP justifying our results with few other studies.[7,13,22] No statistical significance found among the vertical facial growth patterns.
The angle of eminence varies in different individuals and in relation to condyle fossa and different facial growth patterns.
Bjork[30] found that the condyle of patients with a VGP often grew backward, which led to the occurrence of an anterior condylar position to some extent. The condyle often grew backward along with a clockwise rotation of the mandible in patients with a VGP, which contributed to the tendency of the posterior condyle to rotate forward. The situation in patients with an HGP was the opposite, which is inconsistent with our results.
Paknahad and Shahidi[22] reported that the condyles were more anteriorly positioned in patients with a VGP than in those with average and HGP which is contradictory with this study where the condyles are more anteriorly positioned in those with HGP.
In the present study, participants observed were more hypodivergent (HGP) and condyles are positioned more anteriorly in skeletal Class II with HGP than hyperdivergent (VGP) and normodivergent (AGP) results observed were similar to the study by Arieta-Miranda et al.[16]
However, this study cannot confirm a pronounced inclination in the articular eminence which may influence the dysfunction in the TMJ.
The participants in the study were included only based on ANB angle and the facial divergence was evaluated after they were divided into the two skeletal groups. The result of a majority of participants being hypodivergent was a coincidence and not intentional.
No statistically significant difference was observed between skeletal Class I and skeletal Class II concerning growth patterns.
Concerning height of eminence, Katsavrias and Halazonetis studies[24] were performed to evaluate the position and morphology of the TMJ in female patients with skeletal Class II malocclusion and to investigate the association between TMJ disorders and facial types using CBCT and concluded there was no significant difference observed among the high and low angle cases.
This present study evaluated the same in skeletal Class I and skeletal Class II concerning vertical facial growth patterns and the results showed a statistically significant difference concerning the height of eminence. The height was observed more in skeletal Class I concerning hypodivergent. It also demonstrated the existence of a relationship between condyle position to glenoid fossa in skeletal Class I and skeletal Class II malocclusion, sagittally and vertically to asses for any TMJ discrepancies with the most predictable approach using CBCT.
CONCLUSION
From the present study, it was concluded that in skeletal Class II when compared to skeletal Class I:
The condyle in the glenoid fossa was anteriorly positioned with reduced anterior (P = 0.006) and increased posterior (P = 0.04) distance showing an eccentric position
The increased distance in the upper joint space suggesting the condyle was also positioned lower (P = 0.04)
The reduced height of articular eminence (P = 0.01) indicates the condylar path and position relative to the glenoid fossa
Angle of articular eminence (P = 0.44) was decreased. The values suggested a flat articular eminence inclination
No statistically significant difference was noted among different vertical facial morphologies in skeletal Classes I and II.
Clinical significance
The sagittal skeletal pattern has been studied over the years as a potential variable in the condyle-fossa position and therefore is a possible risk factor to be considered in the development of temporomandibular discrepancies. CBCT allows accurate and precise dimensions of joint spaces in the condyle and its relative position in the glenoid fossa in skeletal Class I and skeletal class II malocclusion patterns. It is therefore important for clinicians to prioritize the sagittal relationships along with vertical relationships when executing any orthodontic therapy before ruling out any discrepancy later in life. Therefore, it is relevant to include the vertical facial morphologies, that is, different facial divergent patterns in treatment protocols to rule out its severity in vertical along with the sagittal relationship.
Declaration of patient consent
Institutional Review Board (IRB) permission was obtained for the study.
Financial support and sponsorship
Nil.
Conflicts of interest
There are no conflicts of interest.
References
- Management of Temporomandibular Disorders and Occlusion (4th ed). St. Louis, MO: Mosby; 1998. p. :127-46.
- [Google Scholar]
- Three-dimensional cone-beam computed tomography based comparison of condylar position and morphology according to the vertical skeletal pattern. Korean J Orthod. 2015;45:66-73.
- [CrossRef] [PubMed] [Google Scholar]
- Evaluation of condylar positions in patients with temporomandibular disorders: A cone-beam computed tomographic study. Imaging Sci Dent. 2016;46:127-31.
- [CrossRef] [PubMed] [Google Scholar]
- Application of cone beam computed tomography for assessment of the temporomandibular joints. Aust Dent J. 2012;57:109-18.
- [CrossRef] [PubMed] [Google Scholar]
- What is cone-beam CT and how does it work? Dent Clin North Am. 2008;52:707-30.
- [CrossRef] [PubMed] [Google Scholar]
- Assessing joint space and condylar position in the people with normal function of temporomandibular joint with cone-beam computed tomography. Dent Res J (Isfahan). 2012;9:607-12.
- [CrossRef] [PubMed] [Google Scholar]
- Comparative cone-beam computed tomography evaluation of temporomandibular joint position and morphology in female patients with skeletal Class II malocclusion. J Int Med Res 2020
- [CrossRef] [PubMed] [Google Scholar]
- Computed tomography evaluation of the temporomandibular joint in Class I malocclusion patients: Condylar symmetry and condyle-fossa relationship. Am J Orthod Dentofac Orthop. 2009;136:192-8.
- [CrossRef] [PubMed] [Google Scholar]
- Variations of the temporomandibular joint as revealed by cephalometric laminagraphy. Am J Orthod. 1950;36:877-98.
- [CrossRef] [PubMed] [Google Scholar]
- Assessment of optimal condylar position with cone-beam computed tomography in South Indian female population. J Pharm Bioallied Sci. 2015;7:S121-4.
- [CrossRef] [PubMed] [Google Scholar]
- Radiographic examination of the temporomandibular joint using cone beam computed tomography. Dentomaxillofac Radiol. 2004;33:196-201.
- [CrossRef] [PubMed] [Google Scholar]
- Accuracy of linear measurements using dental cone beam and conventional multislice computed tomography. Dentomaxillofac Radiol. 2008;37:10-7.
- [CrossRef] [PubMed] [Google Scholar]
- Adjusting A-N-B angles to reflect the effect of maxillary position. Angle Orthod. 1981;51:162-71.
- [Google Scholar]
- Analysis of factors affecting angle ANB. Am J Orthod. 1984;85:411-23.
- [CrossRef] [PubMed] [Google Scholar]
- A comparison of ANB, WITS, AF-BF, and APDI measurements. Am J Orthod Dentofac Orthop. 1991;99:122-8.
- [CrossRef] [PubMed] [Google Scholar]
- Spatial analysis of condyle position according to sagittal skeletal relationship, assessed by cone beam computed tomography. Prog Orthod. 2013;14:36.
- [CrossRef] [PubMed] [Google Scholar]
- Variation in condyle-fossa relationships according to different methods of evaluation in tomograms. Oral Surg Oral Med Oral Pathol. 1986;62:719-27.
- [CrossRef] [PubMed] [Google Scholar]
- Some relationships between the glenoid fossa position and various skeletal discrepancies. Am J Orthod. 1972;61:64-78.
- [CrossRef] [PubMed] [Google Scholar]
- Relationship of condylar position to dics position and morphology. Eur J Radiol. 2004;51:269-73.
- [CrossRef] [PubMed] [Google Scholar]
- Clinical Management of Temporomandibular Disorders Chicago, IL: Year Book Medical Publishers; 1982. p. :37.
- [Google Scholar]
- Imaginology tridimensional study of temporomandibular joint osseous components according to sagittal skeletal relationship, sex, and age. J Craniofac Surg. 2019;30:1462-5.
- [CrossRef] [PubMed] [Google Scholar]
- Correlation between articular eminence steepness measured with cone-beam computed tomography and clinical dysfunction index in patients with temporomandibular joint dysfunction. Oral Surg Oral Med Oral Pathol Oral Radiol. 2013;116:91-7.
- [CrossRef] [PubMed] [Google Scholar]
- Temporomandibular joint and normal occlusion: Is there anything singular about it? A computed tomographic evaluation. Am J Orthod Dentofac Orthop. 2011;140:18-24.
- [CrossRef] [PubMed] [Google Scholar]
- Condyle and fossa shape in Class II and Class III skeletal patterns: A morphometric tomographic study. Am J Orthod Dentofac Orthop. 2005;128:337-46.
- [CrossRef] [PubMed] [Google Scholar]
- Tomographic assessment of temporomandibular joints in patients with malocclusion. Angle Orthod. 1996;66:27-35.
- [Google Scholar]
- Association between condylar position and vertical skeletal craniofacial morphology: A cone beam computed tomography study. Int Orthod. 2017;15:740-51.
- [CrossRef] [Google Scholar]
- Improved visualization and assessment of condylar position in the glenoid fossa for different occlusions: A CBCT study. J Contemp Dent Pract. 2016;17:679-86.
- [CrossRef] [PubMed] [Google Scholar]
- Correlations between condylar characteristics and facial morphology in Class II preadolescent patients. Am J Orthod Dentofac Orthop. 1998;114:328-36.
- [CrossRef] [PubMed] [Google Scholar]
- Evaluation of condyle-fossa relationships in adolescents with various skeletal patterns using conebeam computed tomography. Angle Orthod. 2020;90:224-32.
- [CrossRef] [PubMed] [Google Scholar]
- Variations in the growth pattern of the human mandible: Longitudinal radiographic study by the implant method. J Dent Res. 1963;42:400-11.
- [CrossRef] [PubMed] [Google Scholar]


