

Translate this page into:
Craniofacial measurements in children with sella turcica shape’s anomalies

*Corresponding author: Wafa Hammami, Department of Dental Anatomy and Pediatric Dentistry, Dento-Facial Biological and Clinical Approach Laboratory, Faculty of Dentistry, Monastir, Tunisia. hammamiwafaaa@gmail.com
-
Received: ,
Accepted: ,
How to cite this article: Hammami W, Gmati H, Ezzina K, Elelmi Y, Baccouche C, Touzi S, et al. Craniofacial measurements in children with sella turcica shape’s anomalies. APOS Trends Orthod 2021;11:288-94.
Abstract
Objectives:
The objective of the study is to evaluate the cephalometric measurements of Tunisian children who presented sella turcica’s (ST) shape anomalies.
Materials and Methods:
This cross-sectional study was conducted between January and June 2019 in the Department of Pediatric Dentistry of Monastir and Faculty of Dentistry of Tunisia. Radiographs were gathered from patients aged between 7 and 12 years old (n = 104) who had consulted for a malocclusion. The inclusion criteria were considered as follows: Good visibility of anatomic structures and absence of congenital craniofacial deformities. We excluded bad radiographs with errors and discrepancies: Double limits, deformities as well as children having hereditary craniofacial anomalies and underlying diseases. The cephalometric analysis was conducted according to Segner and Hassund’s method. ST’s shape was identified according to Axelsson’s classification modified by Becktor. The sample size was divided into groups: Group 1 with normal ST’s shape and Group 2 with sella’s anomaly. Statistics were performed using IBM SPSS STATISTICS 22. Data normality has been tested using Shapiro–Wilk test. The normality of variance was investigated too with Levene’s test, and comparison of means between groups was performed with t-test.
Results:
The prevalence of aberrations of ST’s form in Tunisian children is about 59.6%. The inclination of upper incisors to the maxilla differed in children with ST’s anomaly compared to normal kids. Children with sella aberration are characterized by retroclination of upper incisors to the maxilla. The variables which showed a statistically significant relationship between abnormalities of ST and cephalometric measurements were 1+NA with P = 0.03 and NL-NSL with P = 0.04.
Conclusion:
The prevalence of ST’s shape anomalies in Tunisian children is about two-thirds. It seems that the anomaly of ST influences the position of the maxilla to the cranial base and the position of upper incisors to the maxilla.
Keywords
Sella turcica
Anomalies
Children
Cephalometric
Dysmorphia

INTRODUCTION
Several cephalometric analyses and different landmarks have pursued through the literature to diagnosis skeletal craniofacial relationship and dentoalveolar malocclusion. Sella turcica (ST) is a very important structure and considered as a reference in the cephalometric analysis. The center of the sella, the S point, is used to measure the position of structures (such as the maxilla or the mandible) to the cranium or to each other.[1] The development of ST took place with this of the pituitary gland and finished after it.[2] Thus, any anomaly of the gland will affect the form of the ST.[2] In the embryological development, neural crest cells and mesodermal cells are involved. Thus, shape anomalies of the ST may be accompanied by functional disorders in the pituitary gland and by morphological abnormalities of the facial bones.[2]
Pediatric dentists and orthodontists are the first detectors of this defect and they contribute to an early diagnosis of hormonal troubles.
The literature reported that the morphological form of ST has been established since the early embryonic stage.[1] Normal shape has been identified since 1924 with three types: Flat, round, and oval. The flat type is the least found and the oval type is the most detected.[3]
The aim of this study is to evaluate the cephalometric measurements of Tunisian children with ST’s shape anomalies.
MATERIALS AND METHODS
One hundred and four lateral radiographs were collected from the Department of Pediatric Dentistry of Monastir of children aged between 7 and 12 years old who had consulted for a malocclusion.
Inclusion criteria
A good visibility of anatomic structures
The absence of congenital craniofacial deformities and underlying diseases.
Non-inclusion criteria
The presence of hereditary craniofacial malformations
Radiographs with errors and discrepancies
Radiographic deformities
Double limits.
Cephalometric measurements were performed according to Segner and Hassund’s analysis.[2] Landmarks were represented in [Figure 1] and measurements in [Table 1].

- Segner and Hassund landmarks.
| Cephalometric value | Definition |
|---|---|
| SNA | Anteroposterior position of point A in relation to anterior cranial fossa. Clinically, this angle describes the sagittal position of the maxilla |
| SNB | Anteroposterior position of mandible in relation to the anterior cranial fossa |
| ANB | Sagittal relation between the maxilla and mandible |
| SNPg | Angle describing the sagittal position of the mandible |
| NSBa | Angle of the cranial base describing the degree of cranial base bending, for example, the relation of clivus to the anterior cranial fossa |
| Gn-tgo-Ar | Mandibular angle describing the inclination between the ramus and corpus of the mandible |
| NL-NSL | Angle describing the inclination of maxillary base to the anterior cranial fossa |
| ML-NSL | Angle specifying the inclination of mandibular base to the anterior cranial fossa |
| ML-NL | Angle describing the inclination between the bases of maxilla and mandible |
| H | Relationship between soft-tissue profile and hard-tissue profile |
| 1+1- | Interincisal angle. The angle between the axis of the upper and lower central incisors |
| 1+:NA | Axis of the upper incisors in reference to maxillary base |
| 1-:NB | Axis of the lower incisors in reference to mandibular base |
| Nasolabial angle | Relationship between the upper lip and nose |
| PG: NB (mm) | Distance between Pg point line between points N and B |
| 1+NA (mm) | Upper incisors in reference to maxillary base |
| 1-NB (mm) | Lower incisors in reference to mandibular base |
| Index | Ratio (%) between the middle and lower face |
| Wits (mm) | Distance between the perpendicular projection of points A and B on occlusal plane |
ST’s shape identification was performed according to Axelsson et al.’s classification modified by Becktor et al.[4] [Table 2].
| Shape of sella turcica | SPSS symbol | Figure |
|---|---|---|
| Normal sella turcica. | 1 | 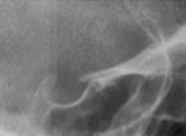 |
| Sella turcica bridge type A—ribbon-like fusion | 2 |  |
| Sella turcica bridge type B—extension of the clinoid processes | 3 |  |
| Incomplete bridge | 4 |  |
| Hypertrophic posterior clinoid process | 5 |  |
| Hypotrophic anterior clinoid process | 6 | 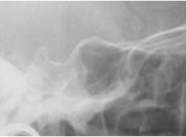 |
| Irregularity (notching) in the posterior part of the sella turcica. | 7 |  |
| Pyramidal shape of the dorsum sellae | 8 |  |
| Double contour of the floor | 9 |  |
| Oblique anterior wall | 10 |  |
| Oblique contour of the floor | 11 | 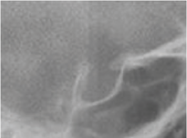 |
The sample size was divided into two groups according to the shape of the ST.[3] – “Group 1” without anomaly of ST with 42 participants and a second “Group 2” of 64 children with sella anomalies. Statistics were performed with IBM SPSS Statistics 22. Data normality was tested using Shapiro– Wilk test. Levene’s test was used for equality of variance and student t-test for comparison of means between the two groups.
RESULTS
Cephalometric measurements
Cephalometric values of the two groups were represented in [Tables 3 and 4]. For each variable, the mean, median, standard deviation, minimum and maximum, and percentiles were calculated.
| Variable | Mean | Standard deviation | Median | Percentile (25) | Percentile (75) | Min | Max |
|---|---|---|---|---|---|---|---|
| SNA | 81.19 | 4.29 | 81.00 | 77.00 | 84.00 | 75.00 | 89.00 |
| SNB | 76.90 | 4.24 | 77.00 | 73.50 | 79.00 | 70.00 | 87.00 |
| ANB | 4.33 | 4.10 | 5.00 | 2.00 | 6.50 | –3.00 | 16.00 |
| SNPg | 76.28 | 4.78 | 75.00 | 73.00 | 81.00 | 69.00 | 87.00 |
| NSBa | 132.76 | 7.11 | 132.00 | 129.50 | 138.00 | 119.00 | 143.00 |
| Gn-tgo-Ar | 131.47 | 3.85 | 132.00 | 128.50 | 134.50 | 124.00 | 139.00 |
| NL-NSL | 9.42 | 3.34 | 09.00 | 7.00 | 11.00 | 6.00 | 20.00 |
| ML-NSL | 9.33 | 6.01 | 39.00 | 34.50 | 41.00 | 31.00 | 55.00 |
| 1+1- | 119.95 | 12.03 | 118.00 | 110.00 | 128.50 | 103.00 | 150.00 |
| 1+:NA angle | 115.33 | 7.70 | 113.00 | 110.50 | 121.05 | 100.00 | 131.00 |
| 1-:NB angle | 92.61 | 9.89 | 92.00 | 84.50 | 98.00 | 79.00 | 116.00 |
| Nasolabial angle | 106.38 | 16.35 | 105.00 | 93.00 | 116.00 | 85.00 | 143.00 |
| Pg: NB (mm) | 1.42 | 1.39 | 1.00 | 0.50 | 02.00 | 0.00 | 05.00 |
| Index | 0.81 | 0.08 | 0.82 | 0.76 | 0.88 | 0.63 | 0.96 |
| Wits (mm) | 2.19 | 3.50 | 2.00 | 1.50 | 4.00 | –11.00 | 07.00 |
| Class I | 1.87 | 0.99 | 2.00 | 1.25 | 2.75 | 0.00 | 0.30 |
| Class II | 7.27 | 3.22 | 6.00 | 05.00 | 07.00 | 5.00 | 16.00 |
| Class III | -02.00 | 1.41 | –02.00 | –3.00 | – | –3.00 | –1.00 |
| Variable | Mean | Standard deviation | Median | Percentile (25) | Percentile (75) | Min | Max |
|---|---|---|---|---|---|---|---|
| SNA | 79.25 | 5.42 | 79.00 | 75.00 | 82.00 | 68.00 | 91.00 |
| SNB | 75.29 | 5.00 | 76.00 | 72.00 | 78.00 | 66.00 | 87.00 |
| ANB | 3.95 | 2.88 | 4.00 | 2.00 | 6.00 | –3.00 | 10.00 |
| SNPg | 75.70 | 5.00 | 76.00 | 73.00 | 79.00 | 66.00 | 88.00 |
| NSBa | 134.25 | 5.96 | 135.00 | 131.00 | 137.00 | 121.00 | 147.00 |
| Gn-tgo-Ar | 131.12 | 5.38 | 131.00 | 128.00 | 135.00 | 121.00 | 142.00 |
| NL-NSL | 7.29 | 3.62 | 07.00 | 5.00 | 10.00 | 1.00 | 14.00 |
| ML-NSL | 6.87 | 5.48 | 37.00 | 34.00 | 41.00 | 24.00 | 46.00 |
| 1+1- | 125.54 | 12.39 | 126.00 | 116.00 | 132.00 | 101.00 | 150.00 |
| 1+:NA angle | 104.83 | 21.24 | 110.00 | 100.00 | 115.00 | 4.00 | 122.00 |
| 1-:NB angle | 93.03 | 9.22 | 92.00 | 89.00 | 100.00 | 67.00 | 110.00 |
| Nasolabial angle | 107.90 | 14.85 | 112.00 | 100.00 | 120.00 | 77.00 | 128.00 |
| Pg: NB (mm) | 1.51 | 1.23 | 1.00 | 1.00 | 02.00 | 0.00 | 05.00 |
| Index | 0.73 | 0.09 | 0.75 | 0.71 | 0.78 | 0.42 | 0.92 |
| Wits (mm) | 2.48 | 2.17 | 2.00 | 1.00 | 4.00 | –03.00 | 07.00 |
| Class I | 2.75 | 1.18 | 3.00 | 2.00 | 4.00 | 01.00 | 04.00 |
| Class II | 6.46 | 1.80 | 6.00 | 5.00 | 7.50 | 05.00 | 10.00 |
| Class III | -2.50 | 0.70 | –2.50 | –3.00 | – | –03.00 | –2.00 |
The comparison of means for each tested variable had led to a small difference between them. Only the inclination of upper incisors to the maxilla (1+NA) was lower in the studied group, Group 2, than the control group with 10° of difference [Table 5].
| Measure | Normality of shape of sella turcica | Mean | Std. Deviation | Std. Error Mean |
|---|---|---|---|---|
| SNA | 1 | 81.19 | 4.297 | 0.938 |
| 0 | 79.40 | 5.456 | 0.996 | |
| SNB | 1 | 76.90 | 4.242 | 0.926 |
| 0 | 75.43 | 5.029 | 0.918 | |
| ANB | 1 | 4.33 | 4.103 | 0.895 |
| 0 | 3.97 | 2.930 | 0.535 | |
| SNPg | 1 | 76.29 | 4.787 | 1.045 |
| 0 | 75.87 | 5.008 | 0.914 | |
| NSBa | 1 | 132.76 | 7.120 | 1.554 |
| 0 | 134.20 | 6.065 | 1.107 | |
| Gn-tgo-Ar | 1 | 131.48 | 3.855 | 0.841 |
| 0 | 131.33 | 5.352 | 0.977 | |
| 1+1- | 1 | 119.95 | 12.035 | 2.626 |
| 0 | 125.53 | 12.607 | 2.302 | |
| 1+: NA | 1 | 115.33 | 7.703 | 1.681 |
| 0 | 104.83 | 21.134 | 3.859 | |
| 1- :NB | 1 | 92.62 | 9.892 | 2.159 |
| 0 | 92.80 | 9.294 | 1.697 | |
| NL-NSL | 1 | 9.43 | 3.340 | 0.729 |
| 0 | 7.20 | 3.652 | 0.667 | |
| ML-NSL | 1 | 39.33 | 6.019 | 1.314 |
| 0 | 36.73 | 5.521 | 1.008 | |
| Nasolabial angle | 1 | 106.38 | 16.357 | 3.569 |
| 0 | 107.43 | 14.871 | 2.715 | |
| Pg/NB | 1 | 1.43 | 1.399 | 0.305 |
| 0 | 1.57 | 1.223 | 0.223 | |
| Index | 1 | 0.8176 | 0.08360 | 0.01824 |
| 0 | 0.7317 | 0.09498 | 0.01734 | |
| Wits | 1 | 2.19 | 3.502 | 0.764 |
| 0 | 2.53 | 2.193 | 0.400 |
Levene’s test for equality of variances [Table 6] showed for all the variables, P > 0.05.
| Measures | Variances | Levene’s test for equality of variances | t-test for equality of means | |||||||
|---|---|---|---|---|---|---|---|---|---|---|
| F | Sig | t | df | Sig. (2-tailed) | Mean difference | Standard error difference | 95% confidence interval of the difference | |||
| Lower | Upper | |||||||||
| SNA | Equal variance assumed | 0.66 | 0.42 | 1.37 | 50 | 0.18 | 1.93 | 1.42 | –0.91 | 4.77 |
| Equal variance not assumed | 1.43 | 48.67 | 0.16 | 1.93 | 1.35 | –0.78 | 4.65 | |||
| SNB | Equal variance assumed | 0.51 | 0.47 | 1.21 | 50 | 0.23 | 1.62 | 1.33 | –1.06 | 4.29 |
| Equal variance not assumed | 1.25 | 47.42 | 0.22 | 1.62 | 1.29 | –0.98 | 4.21 | |||
| ANB | Equal variance assumed | 2.39 | 0.13 | 0.38 | 50 | 0.71 | 0.37 | 0.97 | –1.58 | 2.31 |
| Equal variance not assumed | 0.35 | 33.13 | 0.73 | 0.37 | 1.03 | –1.74 | 2.47 | |||
| SNPg | Equal variance assumed | 0.01 | 0.90 | 0.42 | 50 | 0.68 | 0.57 | 1.39 | –2.22 | 3.38 |
| Equal variance not assumed | 0.42 | 44.35 | 0.68 | 0.57 | 1.38 | –2.20 | 3.35 | |||
| NSBa | Equal variance assumed | 1.30 | 0.26 | –0.80 | 50 | 0.43 | –1.46 | 1.82 | –5.13 | 2.20 |
| Equal variance not assumed | –0.77 | 37.84 | 0.44 | –1.46 | 1.89 | –5.28 | 2.35 | |||
| Gn-tgo-Ar | Equal variance assumed | 1.78 | 0.19 | 0.25 | 50 | 0.80 | 0.35 | 1.36 | –2.39 | 3.09 |
| Equal variance not assumed | 0.27 | 49.80 | 0.79 | 0.35 | 1.28 | –2.28 | 2.92 | |||
| 1+1- | Equal variance assumed | 0.01 | 0.91 | –1.62 | 50 | 0.11 | –5.60 | 3.46 | –12.55 | 1.36 |
| Equal variance not assumed | –1.62 | 43.94 | 0.11 | –5.60 | 3.44 | –12.54 | 1.34 | |||
| 1+: NA | Equal variance assumed | 2.21 | 0.14 | 2.16 | 50 | 0.03 | 10.49 | 4.85 | 0.75 | 20.24 |
| Equal variance not assumed | 2.52 | 40.49 | 0.02 | 10.49 | 4.17 | 2.07 | 18.92 | |||
| 1- :NB | Equal variance assumed | 0.05 | 0.81 | –0.15 | 50 | 0.88 | –0.41 | 2.68 | –5.80 | 4.98 |
| Equal variance not assumed | –0.15 | 41.03 | 0.88 | –0.41 | 2.72 | –5.91 | 5.03 | |||
| NL-NSL | Equal variance assumed | 1.01 | 0.32 | 2.15 | 50 | 0.04 | 2.19 | 0.99 | 0.14 | 4.13 |
| Equal variance not assumed | 2.19 | 45.40 | 0.03 | 2.19 | 098 | 0.17 | 4.11 | |||
| ML-NSL | Equal variance assumed | 0.07 | 0.79 | 1.53 | 50 | 0.13 | 2.46 | 1.61 | –0.77 | 5.70 |
| Equal variance not assumed | 1.50 | 40.31 | 0.14 | 2.46 | 1.64 | –0.85 | 5.78 | |||
| Nasolabial angle | Equal variance assumed | 0.17 | 0.68 | –0.35 | 50 | 0.73 | –1.52 | 4.37 | –10.31 | 7.26 |
| Equal variance not assumed | –0.34 | 40.21 | 0.73 | –1.52 | 4.46 | –10.53 | 7.48 | |||
| Pg/NB | Equal variance assumed | 0.17 | 0.68 | –0.24 | 50 | 0.81 | –0.09 | 0.37 | –0.83 | 0.65 |
| Equal variance not assumed | –0.23 | 39.37 | 0.82 | –0.09 | 0.38 | –0.85 | 0.68 | |||
| Index | Equal variance assumed | 0.10 | 0.75 | 3.36 | 50 | 0.00 | 0.08 | 0.02 | 0.03 | 0.13 |
| Equal variance not assumed | 3.43 | 46.16 | 0.00 | 0.08 | 0.02 | 0.03 | 0.13 | |||
| Wits | Equal variance assumed | 0.11 | 0.75 | –0.37 | 50 | 0.71 | –0.29 | 0.79 | –1.87 | 1.28 |
| Equal variance not assumed | –0.34 | 30.42 | 0.73 | –0.29 | 0.86 | –2.04 | 1.46 | |||
Independent sample student t-test has given a statistical significant relationship for two variables: 1+NA with P = 0.03 and NL-NSL with P = 0.04 [Table 6].
Levene’s test had shown for all variables, P > 0.05 [Table 6].
DISCUSSION
Cephalometric radiograph is a helpful tool in the diagnosis, treatment planning, and predicting the outcome in our practice. The center of ST is routinely used as a cephalometric landmark to act as a reference point for evaluating spatial position of both jaws as their relation to the cranial base.
The variation of ST’s shape has been described by several authors such as Gordon and Bell;[5] Camp;[6] and Tetradis and Kantor.[7] In a recent study, it was categorized into six main types: Normal ST, oblique anterior wall, double-contoured sella, ST bridge, irregularity in the posterior part of the sella, and pyramidal shape of the dorsum sellae.[3] Becktor et al. detailed the sella bridging in complete and incomplete ones.[4]
Several pathologies of the pituitary gland which sat on the pituitary fossa of the sphenoid bone can alter the shape and size of ST. Some patients with an abnormal ST are suffering from several underlying diseases: intrasellar primary tumors, hypopituitarism, and syndromes such as Down and Williams.[8]
Hence, the abnormal morphology of the ST may provide an insight to examine patients suffering from these conditions.
Our study represents a first research in this field in Tunisia. Comparing to the world, the prevalence of ST anomaly in the polish children was 46.9% which is not far from our findings 59.6%.[2] This difference may be due to ethnicity and population special specificities.
Comparison of mean value led to similar cephalometric measurements between the studied and the control group. The only variable that showed a huge difference in mean value was the inclination of upper incisors to the maxilla: 1+:NA with a value of 10° [Table 5]. It seems that the Tunisian children with ST anomalies presented a posterior position of the maxilla to the cranial base comparing to normal children. This result is similar to the polish pediatric population.[2]
Levene’s test had shown for all variables, P > 0.05, which means that the variances of the two groups were equals [Table 6].
Student t-test revealed a statistic significant relationship between the anomaly of ST and the inclination of upper incisors to the maxilla: 1+:NA with P = 0.03 [Table 6] and the position of the maxilla to the cranial base: NL-NSL with P = 0.04 [Table 6]. Thus, ST’s morphology effects the inclination of maxillary bone to the anterior cranial fossa and the anteroposterior position of the upper incisors to the base of the maxilla.
Numeric analysis software is recommended for more precision. Abnormal findings in the morphology of ST which are found in lateral cephalograms should be subjected to advance imaging modalities such as MRI and scanner for confirming the pathology.
CONCLUSION
About 30% of the studied group had a normal sella shape. Cephalometric measurements which range with the sella form are NL-NSL and 1+NA.
The results of the present study can be used as reference standards for Tunisian pediatric population.
Further researches should be conducted to more investigate this participant and to detail the distribution of different ST anomalies in terms of sex and why not to study the relationship between skeletal class and ST aberrations.
Declaration of patient consent
Patient’s consent not required as patient’s identity is not disclosed or compromised.
Financial support and sponsorship
Nil.
Conflicts of interest
There are no conflicts of interest.
References
- The shape and size of the sella turcica in skeletal Class I, Class II, and Class III Saudi subjects. Eur J Orthod. 2007;29:457-63.
- [CrossRef] [PubMed] [Google Scholar]
- Sella turcica anomalies on lateral cephalometric radiographs of Polish children. Dentomaxillofac Radiol. 2014;43:20140165.
- [CrossRef] [PubMed] [Google Scholar]
- Post-natal size and morphology of the sella turcica. Longitudinal cephalometric standards for Norwegians between 6 and 21 years of age. Eur J Orthod. 2004;26:597-604.
- [CrossRef] [PubMed] [Google Scholar]
- A sella turcica bridge in subjects with severe craniofacial deviations. Eur J Orthod. 2000;22:69-74.
- [CrossRef] [PubMed] [Google Scholar]
- A roentgenographic study of the sella turcica in normal children. Endocrinology. 1923;7:52-6.
- [CrossRef] [Google Scholar]
- The normal and pathologic anatomy of the sella turcica as revealed at necropsy. 1923. Radiology. 1:65-73. Available from: https://www.pubs.rsna.org [Last accessed on 2021 Jan 07]
- [CrossRef] [Google Scholar]
- Prevalence of skeletal and dental anomalies and normal variants seen in cephalometric and other radiographs of orthodontic patients. Am J Orthod Dentofacial Orthop. 1999;116:572-7.
- [CrossRef] [Google Scholar]
- Correlation of shape and size of sella turcica with the type of facial skeletal class in an Iranian group. Iran J Radiol. 2015;12:e16059.
- [CrossRef] [Google Scholar]


