

Translate this page into:
Effects of Hawley, Essix, and Vivera® retainers on salivary properties, oral hygiene, and Streptococcus mutans levels: A prospective clinical pilot study

*Corresponding author: Chua Sheng Da Jason, Department of Orthodontics, National Dental Centre Singapore, Singapore. jasonchua_sd@yahoo.com.sg
-
Received: ,
Accepted: ,
How to cite this article: Da Jason CS, Seneviratne CJ, Wong HC, Yow M. Effects of Hawley, Essix and Vivera® retainers on salivary properties, oral hygiene, and Streptococcus mutans levels: A prospective clinical pilot study. APOS Trends Orthod 2021;11:198-208.
Abstract
Objectives:
The objectives of the study were to investigate the in vitro and in vivo effects of various removable orthodontic retainer materials on clinical and microbiological parameters, specifically on saliva characteristics, oral hygiene, and salivary levels of Streptococcus mutans (S. mutans).
Materials and Methods:
This study consists of two parts: An in vitro study and in vivo prospective clinical pilot study. The in vitro study measures surface roughness and S. mutans adhesion of three orthodontic retainer materials: Polymethylmethacrylate (PMMA) used in traditional Hawley removable retainers, polypropylene (PP), and polyurethane (PU) used in vacuum-formed retainers. In the clinical pilot study, 20 subjects, on completion of orthodontic treatment were randomized into three groups to receive PMMA, PP, or PU removable orthodontic retainers. They were compared with control subjects with no orthodontic treatment and retainers. Quantitative analysis of salivary S. mutans using real-time polymerase chain reaction was performed to screen for differences during retainer issue (T0) and 8–15 weeks later (T1). Salivary flow rate, pH, buffering capacity, and plaque scores were also recorded at these two periods for comparison.
Results:
PMMA had significantly greater surface roughness and S. mutans adhesion than PP and PU (P = 0.027). The PMMA group displayed significantly greater amounts of salivary S. mutans count when compared to the PP (0.001) and PU (P = 0.011) groups.
Conclusion:
PMMA retainers showed increased S. mutans adhesion and intra-oral colonization of S. mutans compared to PP and PU retainers. The results validate further clinical testing for a relationship between caries risk and type of retainer prescribed.
Keywords
Orthodontic retainers
Caries
Streptococcus mutans
Real-time polymerase chain reaction
Oral hygiene index

INTRODUCTION
There is increased caries risk during active orthodontic treatment.[1,2] This risk is attributed to fixed orthodontic appliances that complicate conventional oral hygiene measures.[3,4] Surprisingly, studies have found that patients in the retention phase still had more dental plaque and significantly higher prevalence of white spot lesions as compared to controls who did not receive orthodontic treatment.[5,6] This suggests that orthodontic patients in the retention phase may still be susceptible to increased caries risk. In the literature, there are few reports on the impact of different materials used in removable orthodontic retainers on caries risk.[7-9]
An important modifying factor in the caries process is saliva. Although numerous studies[10-12] have been done to investigate the effects of fixed orthodontic appliances on various salivary parameters, no study has been done to determine the relationship between removable orthodontic retainers and salivary flow rate, buffering capacity, and salivary pH.
The traditional Hawley retainer is commonly used for post-orthodontic maintenance of treatment outcome. The major component of the Hawley retainer is polymethylmethacrylate (PMMA). Alternatives to the Hawley retainer is the vacuum-formed retainer (VFR) and the 3D-printed retainer; they are full-tooth coverage dental splint made of thermoformed polypropylene (PP) on plaster models or polyurethane (PU) material on models produced through rapid prototyping otherwise known as additive manufacturing.[13] A study investigating the morphological features and distribution of biofilm in the 3D-printed appliance found that the more recessed and sheltered areas of the appliance, such as the cusp tips, harbored more biofilm than the flat surfaces.[14] An unpublished study comparing bacterial adherence of Streptococcus mutans on PMMA used in Hawley retainers and PP used in VFR found that differences in retainer material and design resulted in a difference in biofilm adhesion for each retainer type which may result in oral health complications such as an increased incidence in caries.[7] Removable orthodontic retainers can be prescribed for up to 24 h of continuous wear for 1 year or more.[15] Retainers may thus act as reservoirs for cariogenic bacteria such as S. mutans.
According to a review published by the Cochrane Collaboration, current retention studies provide insufficient evidence on which to base our clinical practice for the selection of retainers and there is a need for high quality randomized controlled trials in this crucial area of orthodontic practice.[16] Most retainer design, materials, and fabrication have been chosen based on the clinicians’ judgment and patient preferences.
This study consisting of an in vitro study and in vivo clinical pilot study was undertaken to try to establish the clinical underpinnings for retainer choice. The aims of the in vitro study were to determine the differences in surface roughness and S. mutans adhesion among three retainer materials: PMMA, PU, and PP. The primary objective of the clinical pilot study was to analyze the effects of various removable orthodontic retainer types on microbiological parameters, specifically salivary S. mutans levels using real-time quantitative polymerase chain reaction (qPCR). The secondary aims were to compare their differences in salivary flow rate, pH, buffering capacity, and plaque scores.
MATERIALS AND METHODS
In vitro study
Sample disks preparation for in vitro study
Disks measuring 6 mm in diameter and 1.5 mm in thickness were fabricated from three commonly used retainer materials, namely, PMMA, PP, and PU [Figure 1]. To fabricate the PP disk, a sheet of Essix C+® was vacuum formed over a maxillary typodont model made of type 3 stone. A hole punch with a diameter of 6 mm was used on the labial surfaces of the central incisors of the vacuum-formed PP retainer to create disks of equal size and proportion. The same hole punch was used on the labial surfaces of the central incisors of typodont Vivera® retainers to create the PU disks. For the fabrication of PMMA disks, a sheet of soft putty (Aquasil® Soft Putty/ Regular Set, Dentsply) measuring 1.5 mm in thickness was made according to the manufacturer’s instructions. The same hole punch was used to create circles measuring 6 mm in diameter in the putty sheet which serves as a mold to fabricate the PMMA disks. Heat-cured PMMA (Caulk® Orthodontic Resin Pink, Dentsply) was mixed according to the manufacturer’s recommendations and immediately placed inside the putty mold with one side facing the labial surface of the central incisors of the typodont study model made of type 3 stone. After curing with a pressurized cooker, the disks were separated from their molds. No polish or finish was performed but only disks with relatively smooth edges were used for the study.
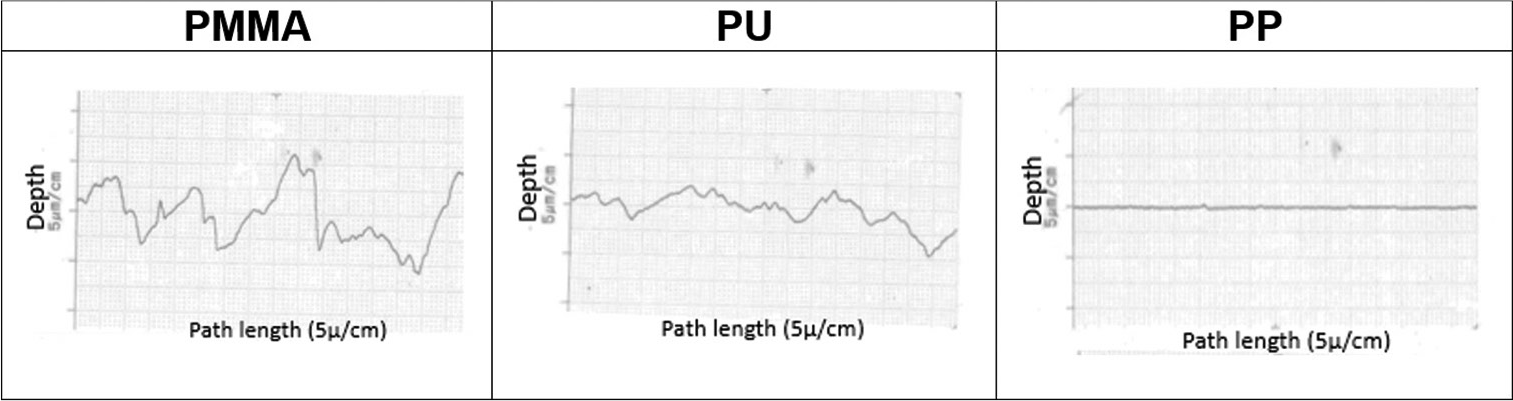
- Graphical profilometer analysis demonstrating the surface roughness of PMMA, PU and PP. PMMA: Polymethylmethacrylate, PP: Polypropylene, PU: Polyurethane.
Measuring the surface roughness of the sample disks
The tooth-contact surface roughness was measured using a stylus profilometer (Surftest SJ-410, Mitutoyo) with a conical detector (taper angle: 60°, stylus radius: 2 μm) covering the diameter of the disk. Five samples per material (PMMA, PP, and PU) were used to obtain five readings and the median value was recorded.
S. mutans biofilm formation
To determine the sample size required, a pilot study was performed with six disks per material (PMMA, PP, and PU) and an additional six samples of two disks per material as sterile controls. All disks were placed in a 96-well plate (Corning® Costar®, flat bottom) and sterilized under ultra-violet light for 60 min before inoculation with test media. 200 μl of S. mutans (strain UA159) broth which is equivalent to 108 colony-forming unit was added to each well containing the test samples. The control disks were bathed in brain-heart infusion medium to act as sterile controls. A sample size calculation was performed and at least eight samples per group were needed to detect a difference in S. mutans adhesion at a significance level of 5% with a power of 80%.
The above inoculation procedures were then repeated with 36 samples per material for the actual study.
Crystal violet (CV) assay
After aerobic incubation at 37°C for 24 h, the inoculated samples were fixed with 2% formalin before being stained with 1% CV (Sigma, USA). About 95% ethylic alcohol (Merck, Singapore) was applied to resolubilize the dye bounded to biofilms. Colored solutions obtained were transferred to a new sterile flat bottom 96-wells plate and the optical density of the content was measured using a microtiter plate spectrophotometer (Multiskan™ GO Microplate Spectrophotometer, Thermo Fisher Scientific) at 570 nm. The extent of S. mutans adhesion is proportional to the optical density results.
Scanning electron microscopy (SEM)
Specimens with biofilm exposure were first washed in distilled water to remove non-adhered bacteria before fixation in 2.5% glutaraldehyde (Sigma, Singapore) overnight at 4°C. Dehydration process was performed by washing the samples in succession of ethanol alcohol (70% for 1 h, 95% for 10 min, and 100% for 10 min), and placed in the desiccator to be aired before low-pressure atmospheric gold sputter coating (Jeol JFC1 100: Jeol, Tokyo, Japan). SEM (Philips XL30CP) was then used to visualize the surface structure of sterilized disks and also the complex structure of biofilm formed on the inoculated disk samples.
Prospective clinical pilot study
Ethical approval
The in vivo prospective clinical pilot study was approved by the Centralized Institutional Review Board of SingHealth (reference code 2015/2735).
Recruitment of subjects for clinical pilot study
Twenty test subjects were recruited from the pool of orthodontic patients poised to complete orthodontic treatment with fixed appliances at the National Dental Centre of Singapore. The inclusion criteria for the test subjects at the start of the study were: Males and females between 14 and 60-years-old, permanent dentition of at least 24 teeth and completed orthodontic treatment with the upper and lower fixed appliances. The exclusion criteria for the test subjects were: Having active carious lesions, presence of periodontal or systemic diseases, use of oral antimicrobial agents or antibiotic within 3 months before the removal of the fixed appliances, topical fluoride application (except for fluoridated dentifrice), presence of prosthodontic appliances (fixed or removable), and requiring fixed bonded retainers and orthognathic surgical cases. Four control subjects were recruited at the same time. The inclusion criteria for the control subjects were: Males and females between 14 and 60-years-old, permanent dentition of at least 24 teeth, no history of any form of orthodontic treatment, or use of orthodontic retainers and having an Index of Treatment Need (IOTN) score of 2 or below. The exclusion criteria for the controls were: Having active carious lesions, presence of periodontal or systemic diseases, use of oral antimicrobial agents or antibiotic within 3 months before the removal of the fixed appliances, topical fluoride application (except for fluoridated dentifrice), and the presence of prosthodontic appliances (fixed or removable).
Informed consent was taken from the adult individual or the parents of adolescents below 21 years of age, before the removal of fixed appliances. Further to this, assent was obtained from all adolescents below the age of 21.
Randomization of test subjects
The recruited test subjects are assigned to either retainer group (Hawley - PMMA, Essix - PP, Vivera® - PU) by simple randomization generated through an online generator: www.randomization.com.
Issue of retainer
The test subjects received their retainers 1–2 weeks after the removal of the fixed orthodontic appliances. They were asked to use their retainers 24 h a day except during eating and brushing. All subjects were asked to refrain from eating, drinking, tooth brushing or mouth rinsing at least 2 h before their subsequent appointments.
Sampling of saliva
Unstimulated saliva is collected by asking the subject to spit into a sterile tube (Greiner, 15 ml Cellstar® PP Tube) for 5 min. The collected saliva is stored in a coolant bag before being transported to the laboratory within 8 h for qPCR analysis of S. mutans. To measure the flow rate, the sterile tube is first weighed using a professional digital mini scale (Tanita Model 1479V). After 5 min of spitting into the collection tube, it is weighed again. The flow rate is thus obtained by dividing the difference of the combined weight of the tube and saliva and weight of the tube with time. The flow rate of gram/minute is then converted to ml/minute based on a 1:1 ratio assuming that saliva density is 1 g/ml. The pH and buffering capacity of unstimulated and stimulated saliva is obtained using the pH test strip and buffer test strip (GC Saliva-Check BUFFER test kit), respectively and following the manufacturer’s instructions. The above saliva sampling procedures are performed in the mid-day at 2 time points: (T0) 1–2 weeks after debonding when the test subject is issued the retainer or the first visit for control subjects and at (T1) 8–15 weeks later.
Record of plaque score
The teeth of the test subjects are stained by applying the GC Tri Plaque ID Gel™ onto every surface of each tooth and the subject is asked to rinse twice after application. Plaque score is then recorded for the pink/red stains using the O’Leary Index[17] up to the second molars in each quadrant. The recording of plaque score was performed at 2 time points as mentioned above.
DNA extraction from unstimulated saliva and Real-time PCR
One milliliter of whole saliva was centrifuged at 5000 rpm for 15 min to obtain the pellet. Bacterial chromosomal DNA was then extracted using the QIAamp® UCP Pathogen Mini Kit (QIAGEN) according to the manufacturer’s instructions. A NanoDrop spectrophotometer (Thermo Scientific, Model ND-1000) was used to assess the quality of the extracted DNA after preparation. The SM479 and Uni3 primer was used for the priming of S. mutans and total amount of bacteria, respectively, in the qPCR process. The sequences of the primers are listed as below:
Primer SM479 Forward
→5’-TCGCGAAAAAGATAAACAAACA-3’
Primer SM479 Reverse
→5’-GCCCCTTCACAGTTGGTTAG-3’
Primer Uni3 Forward
→5’-TCCTACGGGAGGCAGCAGT-3’
Primer Uni3 Reverse
→5’-GGACTACCAGGGTATCTAATCCTGTT-3’
All primers were commercially synthesized (Integrated DNA Technologies Pte. Ltd., Singapore Science Park II). DNA was first extracted from S. mutans (strain UA159) to generate standard curves. DNA concentration was estimated by absorbance at 600 nm and series of 10-fold dilutions from 103 to 108 copies were prepared for standard curves. The amount of bacterial DNA in the test samples was then extrapolated from the standard curve to quantify the amount of S. mutans and total bacteria. Real-time PCR was performed using the StepOnePlus™ Real-Time PCR System (Thermo Fisher Scientific). The reaction mixtures contained 1 μl of purified DNA from the saliva sample, 0.8 μl of primer, 20 μl of KAPA SYBR® FAST qPCR Master Mix (KAPA Biosystems), 0.8 μl of Rox high (KAPA Biosystems), and 8 μl of nuclease-free, deionized, distilled water (HyPure™ Molecular Biology Grade Water, HyClone™). The samples were subjected to an initial amplification for 3 min at 95°C, 40 cycles of denaturation for 1 min at 60°C, and primer annealing for 15 s at 95°C. All experiments for quantifying the bacteria were performed in duplicates.
Statistical analysis
For the in vitro study, statistical analysis was performed with Kruskal–Wallis test and for pairwise comparisons; Mann– Whitney U-test was used with Bonferroni correction. For the in vivo clinical study, linear regression analysis was carried out to evaluate the T1 data adjusting for their respective baseline (T0) measurements. All analyses were done using SAS version 9.4 (SAS Institute Inc., Cary, NC, USA) and evaluated at a significance level of 5%.
RESULTS
Results of in vitro study
Surface roughness of sample disks
There were significant differences in the median surface roughness among the PMMA, PU, and PP disks. PMMA had significantly greater median surface roughness than PU (P = 0.027) and PP (P = 0.027). PU had significantly greater median surface roughness than PP (P = 0.027) [Table 1]. The relatively straight graph for PP suggests that PP has the least surface roughness as shown in [Figure 1].
| Retainer material | Surface roughness (μm) | P-value | |
|---|---|---|---|
| Median | Range | ||
| PMMA (n=5) | 2.13 | 1.89–2.69 | 0.027 |
| PU (n=5) | 1.09 | 0.96–1.14 | 0.027 |
| PP (n=5) | 0.10 | 0.05–0.21 | 0.027 |
PMMA: Polymethylmethacrylate, PP: Polypropylene, PU: Polyurethane
S. mutans adhesion on sample disks
There were significant differences in the optical density values among the PMMA, PU, PP, and control disks (P <0.001). There was significantly greater S. mutans adhesion on all three materials when compared to controls (P < 0.001). PMMA had significantly greater S. mutans adhesion when compared to PU and PP (P < 0.001). PU had significantly greater S. mutans adhesion when compared to PP (P < 0.001) [Table 2].
| Group | Optical density (570 nm) | P-value | |
|---|---|---|---|
| Median | Range | ||
| PMMA (n=36) | 2.45 | 1.84–3.33 | <0.001 |
| PU (n=36) | 0.98 | 0.78–1.27 | <0.001 |
| PP (n=36) | 0.54 | 0.33–0.84 | <0.001 |
| Control (n=36) | 0.20 | 0.11–0.38 | <0.001 |
PMMA: Polymethylmethacrylate, PP: Polypropylene, PU: Polyurethane
Ultrastructural features of the biofilms on sample disks
In [Figure 2], the SEM images captured the surface profile of the disks before exposure to S. mutans inoculation (sterilized disks). The PMMA disk surface showed more porosity and irregularities with multiple crack and craze lines as compared to the PP disk. Similarly, multiple groove-like crevices can be observed on the PU disk surface which may act as reservoirs for microbial adhesion. SEM images of biofilms formed on the surface of the disks after S. mutans inoculation are represented in the last column of [Figure 2]. It can be observed that the PMMA disk surface was extensively covered by amorphous matrices, which represents the extracellular polymeric substance of the S. mutans biofilm. There is more S. mutans colonization on the PMMA disk surface when compared to that of the PP and PU disks. Similarly, there is greater biofilm formation on the PU disk when compared to the PP disk.

- Images of sample disks and SEM images of sterilized and inoculated disks.
Results of clinical pilot study
Demographic information of subjects
Demographic information of the clinical subjects is shown in [Table 3].
| Retainer group/control | ||||
|---|---|---|---|---|
| PMMA | PP | PU | Control | |
| Female | 4 (28.6%) | 5 (35.6%) | 2 (14.3%) | 3 (21.4%) |
| Male | 3 (30.0%) | 2 (20.0%) | 4 (40.0%) | 1 (10.0%) |
| Total number of subjects | 7 (29.2%) | 7 (29.2%) | 6 (25.0%) | 4 (16.7%) |
| Median age on day of debonding in years (range) | 16.2 (15.2–21.3) | 16.0 (14.3–17.6) | 17.0 (15.1–20.5) | N.A. |
| Median age at baseline (T0) in years (range) | 16.3 (15.3–21.4) | 16.0 (14.3–17.6) | 17.1 (15.2–20.5) | 28.9 (26.9–29.4) |
| Median age at review (T1) in years (range) | 16.5 (15.5–21.6) | 16.3 (14.6–17.7) | 17.3 (15.3–20.8) | 29.1 (27.1–29.6) |
PMMA: Polymethylmethacrylate, PP: Polypropylene, PU: Polyurethane
Flow rate, pH, and buffering capacity of unstimulated saliva
As shown in [Table 4], there were no significant differences in the flow rate, pH, and buffering capacity of unstimulated saliva at T1 for the PMMA, PP, PU, and control groups after adjusting for their respective baseline measurements. For the actual clinical values, please refer to [Table 5].
| Adjusted for respective baseline (T0) measurements | |||
|---|---|---|---|
| Regression coefficient (95% confidence interval) | P-value | ||
| Flow rate/ml/min | Retainer group | 0.480 | |
| PMMA compared with control | 0.044 (−0.372–0.461) | 1 | |
| PP compared with control | 0.115 (−0.292–0.523) | 1 | |
| PU compared with control | 0.202 (−0.227–0.632) | 1 | |
| PMMA compared with PP | −0.071 (−0.418–0.276) | 1 | |
| PMMA compared with PU | −0.158 (−0.516–0.200) | 1 | |
| PP compared with PU | −0.087 (−0.449–0.275) | 1 | |
| pH | Retainer group | 0.835 | |
| PMMA compared with control | 0.008 (−0.575–0.591) | 1 | |
| PP compared with control | −0.123 (−0.687–0.441) | 1 | |
| PU compared with control | −0.088 (−0.676–0.499) | 1 | |
| PMMA compared with PP | 0.131 (−0.353–0.615) | 1 | |
| PMMA compared with PU | 0.097 (−0.401–0.594) | 1 | |
| PP compared with PU | −0.034 (−0.531–0.463) | 1 | |
| Buffering capacity | Retainer group | 0.614 | |
| PMMA compared with control | −0.787 (−2.781–1.208) | 1 | |
| PP compared with control | −0.632 (−2.608–1.343) | 1 | |
| PU compared with control | −0.232 (−2.297–1.833) | 1 | |
| PMMA compared with PP | −0.154 (−1.846–1.537) | 1 | |
| PMMA compared with PU | −0.555 (−2.307–1.198) | 1 | |
| PP compared with PU | −0.400 (−2.170–1.369) | 1 | |
PMMA: Polymethylmethacrylate, PP: Polypropylene, PU: Polyurethane
| Group | PMMA (n=7) | PP (n=7) | PU (n=6) | Control (n=4) | |||||
|---|---|---|---|---|---|---|---|---|---|
| T0 | T1 | T0 | T1 | T0 | T1 | T0 | T1 | ||
| Flow rate/ml/min | Median | 1.26 | 1.30 | 1.30 | 1.10 | 1.15 | 1.13 | 0.88 | 0.67 |
| Min | 0.96 | 1.00 | 0.46 | 0.40 | 0.28 | 0.68 | 0.64 | 0.60 | |
| Max | 1.80 | 1.64 | 1.92 | 2.32 | 2.84 | 3.02 | 1.26 | 1.34 | |
| Difference in flow rate between T0 and T1/ml/min | Median | −0.02 | −0.02 | 0.16 | −0.04 | ||||
| Min | −0.18 | −0.24 | −0.24 | −0.38 | |||||
| Max | 0.08 | 0.40 | 0.40 | 0.08 | |||||
| pH | Median | 7.6 | 7.6 | 7.8 | 7.6 | 7.6 | 7.6 | 7.7 | 7.6 |
| Min | 6.8 | 7.2 | 7.0 | 6.6 | 6.8 | 7.0 | 7.6 | 7.6 | |
| Max | 7.8 | 7.8 | 7.8 | 7.8 | 7.8 | 7.8 | 7.8 | 7.8 | |
| Difference in pH between T0 and T1 | Median | 0 | 0 | 0 | 0 | ||||
| Min | −0.2 | −1.0 | −0.4 | −0.2 | |||||
| Max | 0.8 | 0.6 | 0.6 | 0 | |||||
| Buffering capacity | Median | 12 | 12 | 12 | 12 | 11.5 | 12 | 12 | 12 |
| Min | 8 | 9 | 10 | 9 | 9 | 9 | 11 | 12 | |
| Max | 12 | 12 | 12 | 12 | 12 | 12 | 12 | 12 | |
| Difference in buffering capacity | Median | 0 | 0 | 0 | 0 | ||||
| Min | −2 | −2 | −2 | 0 | |||||
| Max | 1 | 1 | 3 | 1 | |||||
PMMA: Polymethylmethacrylate, PP: Polypropylene, PU: Polyurethane
Plaque scores
As shown in [Table 6], there was no significant difference in the plaque score at T1 for the PMMA, PP, PU, and control group after adjusting for their respective baseline measurements. For the actual clinical values, please refer to [Table 7].
| Adjusted for respective baseline (T0) measurements | |||
|---|---|---|---|
| Regression coefficient (95% confidence interval) | P-value | ||
| Plaque score/% | Retainer group | 0.874 | |
| PMMA compared with control | 0.816 (−23.583–25.214) | 1w | |
| PP compared with control | −4.553 (−28.724–19.618) | 1 | |
| PU compared with control | −2.689 (−27.926–22.548) | 1 | |
| PMMA compared with PP | 5.368 (−15.311–26.048) | 1 | |
| PMMA compared with PU | 3.505 (−17.920–24.930) | 1 | |
| PP compared with PU | −1.864 (−23.470–19.743) | 1 | |
PMMA: Polymethylmethacrylate, PP: Polypropylene, PU: Polyurethane
| Group | PMMA | PP | PU | Control | |||||
|---|---|---|---|---|---|---|---|---|---|
| T0 | T1 | T0 | T1 | T0 | T1 | T0 | T1 | ||
| Plaque score/% | Median | 44.8 | 50.0 | 56.3 | 48.2 | 42.0 | 41.2 | 49.6 | 54.9 |
| Min | 26.0 | 27.7 | 30.2 | 25.0 | 22.3 | 24.1 | 41.1 | 33.0 | |
| Max | 69.2 | 63.5 | 70.0 | 67.9 | 72.9 | 78.1 | 74.1 | 62.5 | |
| Difference in plaque score | Median | 4.1 | −4.5 | 2.8 | −5.0 | ||||
| Min | −19.2 | −32.5 | −12.5 | −16.1 | |||||
| Max | 37.5 | 16.7 | 10.8 | 17.0 | |||||
PMMA: Polymethylmethacrylate, PP: Polypropylene, PU: Polyurethane
Bacterial counts
As shown in [Table 8], the S. mutans counts at T1 for the PMMA group were significantly higher compared to the PP (P = 0.001) and PU (P = 0.011) group after adjusting for S. mutans counts at baseline (T0). The proportions of S. mutans to total bacteria at T1 for the PMMA group were significantly higher compared to the PP (P = 0.003) and PU (P = 0.021) group after adjusting for its baseline value (T0). For the actual values, please refer to [Table 9].
| Adjusted for respective baseline (T0) measurements | |||
|---|---|---|---|
| Regression coefficient (95% confidence interval) | P-value | ||
| S. mutans counts (log10) | Retainer group | 0.001 | |
| PMMA compared with control | 1.518 (−0.551–3.546) | 0.241 | |
| PP compared with control | −1.228 (−3.120–0.663) | 0.427 | |
| PU compared with control | −0.578 (−2.566–1.411) | 1 | |
| PMMA compared with PP | 2.746 (1–4.492) | 0.001 | |
| PMMA compared with PU | 2.095 (0.385–3.805) | 0.011 | |
| PP compared with PU | −0.651 (−2.363–1.061) | 1 | |
| Total bacteria counts (log10) | Retainer group | 0.124 | |
| PMMA compared with control | −0.308 (−0.700–0.084) | 0.192 | |
| PP compared with control | −0.217 (−0.607–0.173) | 0.710 | |
| PU compared with control | −0.311 (−0.713–0.091) | 0.208 | |
| PMMA compared with PP | −0.091 (−0.429–0.247) | 1 | |
| PMMA compared with PU | 0.003 (−0.344–0.349) | 1 | |
| PP compared with PU | 0.094 (−0.255–0.442) | 1 | |
| Proportion of S. mutans/Total bacteria/% | Retainer group | 0.003 | |
| PMMA compared with control | 17.227 (−7.623–42.078) | 0.332 | |
| PP compared with control | −13.767 (−37.053–9.519) | 0.588 | |
| PU compared with control | −6.563 (−30.974–17.848) | 1 | |
| PMMA compared with PP | 30.994 (9.487–52.501) | 0.003 | |
| PMMA compared with PU | 23.790 (2.720–44.860) | 0.021 | |
| PP compared with PU | −7.204 (−28.284–13.876) | 1 | |
The absolute bacteria counts were log10 transformed. The proportion of S. mutans to total bacteria counts was calculated using the absolute bacteria counts. S. mutans: Streptococcus mutans, PMMA: Polymethylmethacrylate, PP: Polypropylene, PU: Polyurethane
| Group | PMMA | PP | PU | Control | |||||
|---|---|---|---|---|---|---|---|---|---|
| T0 | T1 | T0 | T1 | T0 | T1 | T0 | T1 | ||
| S. mutans(log10) | Median | 3.25 | 5.41 | 5.66 | 3.78 | 4.77 | 3.23 | 6.60 | 5.87 |
| Min | 1.89 | 2.99 | 2.23 | 1.89 | 1.71 | 2.14 | 1.92 | 1.75 | |
| Max | 5.80 | 6.41 | 6.90 | 5.55 | 6.65 | 5.81 | 6.74 | 6.39 | |
| Difference in S. mutans(log10) | Median | 1.40 | −1.67 | −0.28 | −0.42 | ||||
| Min | 0.61 | −3.18 | −2.89 | −0.98 | |||||
| Max | 2.63 | −0.02 | 1.02 | −0.17 | |||||
| Total Bacteria (log10) | Median | 8.39 | 8.64 | 8.18 | 8.71 | 8.26 | 8.77 | 8.25 | 8.97 |
| Min | 7.65 | 8.39 | 7.79 | 8.58 | 7.75 | 8.40 | 7.64 | 8.62 | |
| Max | 8.79 | 8.93 | 8.51 | 8.97 | 8.70 | 8.82 | 8.61 | 9.34 | |
| Difference in total bacteria (log10) | Median | 0.12 | 0.69 | 0.35 | 0.51 | ||||
| Min | 0.01 | 0.07 | 0.10 | 0.42 | |||||
| Max | 1.12 | 1.03 | 1.07 | 1.70 | |||||
| S. mutans/total bacteria/% | Median | 36.97 | 61.82 | 68.46 | 42.47 | 57.18 | 37.33 | 78.04 | 66.43 |
| Min | 22.74 | 35.64 | 28.63 | 21.70 | 19.66 | 25.48 | 25.13 | 18.74 | |
| Max | 74.26 | 75.12 | 82.73 | 64.45 | 85.81 | 66.17 | 82.32 | 71.80 | |
| Difference in S. mutans/total bacteria/% | Median | 16.16 | −23.88 | −5.73 | −8.56 | ||||
| Min | −2.48 | −40.83 | −43.18 | −17.00 | |||||
| Max | 30.03 | −3.14 | 10.66 | −6.01 | |||||
The absolute bacteria counts were log10 transformed. The proportions of S. mutans to total bacteria were calculated using the absolute bacteria counts. S. mutans: Streptococcus mutans, PMMA: Polymethylmethacrylate, PP: Polypropylene, PU: Polyurethane
DISCUSSION
Surface roughness plays an important role in biofilm adhesion. This study has demonstrated that the surface roughness is highest for PMMA and PP had the least surface roughness. There was a five-fold increase in S. mutans adhesion for PMMA when compared to PP and 2½ times increase in S. mutans adhesion for PMMA when compared to PU which demonstrated increased biofilm adhesion on rougher surfaces. This is in agreement with the in vitro study by Pfepper[7] who found a seven-fold increase in S. mutans adhesion for PMMA when compared to PP.
There was no significant difference in the salivary flow rate, pH, and buffering capacity among the PMMA, PP, PU, and control groups. As no study has been done to investigate the relationship between removable retainers and salivary properties, the present study is thus the first to report this relationship. However, studies[18,19] that investigated the influence of fixed appliances on salivary properties could help explain the results in the present study. These studies hypothesized that there were no changes in salivary parameters because the salivary properties might have adjusted to the placement of fixed orthodontic appliances after a prolonged period. The salivary parameters might have adjusted to the presence of retainers after a prolonged period, thus returning to baseline (T0) values with a similar sort of “adaptive behavior” occurring from long-term wear.
Fixed orthodontic appliances lead to increased plaque accumulation on both the appliances and surfaces of the teeth.[10,11] However, in the present study, there was no difference in the plaque score among the PMMA, PP, PU, and control groups. This was expected as removable retainers do not hinder oral hygiene performance. Besides, all the subjects were young and healthy individuals with normal manual dexterity and received oral hygiene and retainer maintenance instructions. The result is in agreement with a study which reported a decreased oral hygiene index at 13 weeks after removal of orthodontic appliances in a group of 58 patients.[9]
In the present study, salivary S. mutans levels were analyzed to determine the intra-oral colonization of S. mutans, which have been reported in many other studies as a surrogate for dental caries.[20-22] There are several advantages in carrying out bacterial analysis in saliva samples compared with plaque samples such as the ease of sample collection, non-invasiveness, and concurrent measurement of other parameters such as the pH and no restriction to a localized site. Other studies[9,23] have also reported the use of unstimulated instead of stimulated saliva for analysis of S. mutans levels and one of the authors[9] was contacted through email to clarify the rationale for this. According to the author, the shortcomings of collecting stimulated saliva are contamination from the paraffin wax and less uniform saliva collection as compared to unstimulated saliva. Various methods have been used to identify salivary bacteria such as culturing bacteria on agar, biochemical tests, and immunologic methods. However, these techniques may be too time consuming and costly. Real-time qPCR has emerged as a more rapid and sensitive method of detecting and semi-quantifying specific bacterial species.[24] A study that employed qPCR to analyze changes in salivary levels of S. mutans and total bacteria after orthodontic treatment with fixed appliances found an increase in S. mutans at 5 and 13 weeks after debonding of the fixed appliances.[9]
As compared to the study by Jung et al.,[9] there was an increased in salivary S. mutans only in the PMMA group in the present study. It should be noted that the type of retainer given to the patients was not mentioned in the study by Jung et al.[9] The results for the PP and PU groups in the present study is in agreement with another study by Türköz et al.[23] which found no significant increase in salivary S. mutans at 60 days after removal of fixed appliances in a group of 40 subjects wearing thermoplastic VFRs. The results of the in vitro study could be extrapolated to explain the increased in salivary S. mutans only in the PMMA group in the present study. Increased surface roughness in the PMMA retainers leads to enhanced S. mutans adhesion on the retainers which thus resulted in increased salivary colonization of S. mutans as compared to the PP, PU, and control groups.
The ideal control for the present study would be patients who did not receive any retainers after removal of the fixed appliances. However, this was clinically unacceptable due to the risk of changes to the treatment outcome if a retainer was not worn after removal of orthodontic appliances. Hence, the control group comprised of individuals with no history of orthodontic treatment and appliance wear. Patients with a low IOTN score of 2 and below were selected to match the post-treatment alignment of orthodontically treated subjects as much as possible and to reduce the likelihood of increased plaque scores in severe malocclusions. One factor which may affect the intra-oral colonization of S. mutans is the compliance and daily duration of retainer wear by the test subjects. Poor compliance in retainer wear may lead to insufficient time and opportunity for S. mutans to colonize the intra-oral environment. Hence, a survey on the duration of retainer wear or the use of technology such as the Smart Retainer environmental microsensor (Scientific Compliance, Atlanta, Ga) could be incorporated into the retainers to monitor compliance. Another possible factor is the diet of the test subjects. A cariogenic diet high in fermentable carbohydrate may promote the growth of S. mutans thus increasing the intra-oral colonization of S. mutans. A diet history is informative as diet is a factor which influences the caries risk of the test subjects.
Based on the results of this pilot study, further clinical testing should be conducted to determine if there is a relationship between caries risk and the type of retainer prescribed. If a PMMA retainer must be prescribed, it may be beneficial to advise patients to take extra care in oral hygiene and prophylaxis measures during retention. Other means of producing 3D-printed study models, such as the Continuous Liquid Interface Production method, could be explored for the fabrication of VFR as these working models tend to have much smoother surfaces.
CONCLUSION
S. mutans plays an important role in the caries process. However, the process of caries initiation and progression is more complex and associated with many other different factors such as host factors, substrate factors, and time. Therefore, to evaluate the clinical relevance of the findings, caries incidence associated with the various retainer groups should be used as an outcome measure. Nevertheless, the present study demonstrated that within the parameters that have been set in the in vitro study, there is increased S. mutans adhesion for the PMMA material as compared to the PP and PU materials. This may be attributed to the inherent surface roughness of the PMMA material. In the clinical pilot study, there is increased intra-oral colonization of S. mutans in the PMMA retainer group. Therefore, further clinical testing should be conducted to determine if there is a relationship between caries risk and type of retainer prescribed.
Acknowledgments
The authors acknowledge that this research was funded in-part by the International Align Research Award by Align Technology, Inc. The funding source had no influence on any part of the study design; collection, analysis, and interpretation of data; writing of the report; decision to submit the article for publication; and choice of journal.
Declaration of patient consent
The authors certify that they have obtained all appropriate patient consent.
Financial support and sponsorship
International Align Research Award by Align Technology, Inc.
Conflicts of interest
There are no conflicts of interest.
References
- Prevalence of carious white spots after orthodontic treatment with multibonded appliances. Eur J Orthod. 1986;8:229-34.
- [CrossRef] [PubMed] [Google Scholar]
- Caries risk and orthodontic treatment. Int Orthod. 2010;8:28-45.
- [CrossRef] [PubMed] [Google Scholar]
- Study of dental plaque in orthodontic patients. J Dent Res. 1970;49:320-4.
- [CrossRef] [PubMed] [Google Scholar]
- Enamel demineralization during orthodontic treatment. Aetiology and prevention. Aust Dent J. 1997;42:322-7.
- [CrossRef] [PubMed] [Google Scholar]
- Increase in detectable opportunistic bacteria in the oral cavity of orthodontic patients. Int J Dent Hyg. 2009;7:121-5.
- [CrossRef] [PubMed] [Google Scholar]
- Prevalence of white spot lesions in 19-year-olds: A study on untreated and orthodontically treated persons 5 years after treatment. Am J Orthod Dentofacial Orthop. 1989;96:423-7.
- [CrossRef] [Google Scholar]
- Bacterial Adherence of Streptococcus mutans and Lactobacillus acidophilus on Poly-methyl Methacrylate and Thermoplastic Polypropene Used in Orthodontic Retention. Theses.
- [Google Scholar]
- Salivary Streptococcus mutans levels in patients before, during, and after orthodontic treatment. Am J Orthod Dentofacial Orthop. 1991;100:35-7.
- [CrossRef] [Google Scholar]
- Quantitative analysis of changes in salivary mutans streptococci after orthodontic treatment. Am J Orthod Dentofacial Orthop. 2014;145:603-9.
- [CrossRef] [PubMed] [Google Scholar]
- The effect of orthodontic treatment on salivary flow, pH, buffer capacity, and levels of mutans streptococci and lactobacilli. Aust Orthod J. 1999;15:229-34.
- [Google Scholar]
- Effect of orthodontic treatment on saliva, plaque and the levels of Streptococcus mutans and Lactobacillus. Med Oral Patol Oral Cir Bucal. 2010;15:e924-9.
- [CrossRef] [PubMed] [Google Scholar]
- Salivary microbial and nonmicrobial parameters in children with fixed orthodontic appliances. Angle Orthod. 2011;81:901-6.
- [CrossRef] [PubMed] [Google Scholar]
- Align Vivera Align Technology. Inside Dentistry. Available from: https://www.aegisdentalnetwork.com/id/2009/05/align-vivera-orthodontic-retainers-align-technology [Last accessed on 2019 Jun 06]
- [Google Scholar]
- Ultrastructure and morphology of biofilms on thermoplastic orthodontic appliances in “fast” and “slow” plaque formers. Eur J Orthod. 2011;33:577-83.
- [CrossRef] [PubMed] [Google Scholar]
- Orthodontic retention: A systematic review. J Orthod. 2006;33:205-12.
- [CrossRef] [PubMed] [Google Scholar]
- Effect of fixed orthodontic appliances on salivary properties. Prog Orthod. 2013;14:13.
- [CrossRef] [PubMed] [Google Scholar]
- Changes in the oral environment after placement of lingual and labial orthodontic appliances. Prog Orthod. 2013;14:28.
- [CrossRef] [PubMed] [Google Scholar]
- Close association between Streptococcus sobrinus in the saliva of young children and smooth-surface caries increment. Caries Res. 1993;27:292-7.
- [CrossRef] [PubMed] [Google Scholar]
- Salivary mutans streptococci and incidence of caries in preschool children. Caries Res. 1995;29:148-53.
- [CrossRef] [PubMed] [Google Scholar]
- Caries incidence in relation to salivary mutans streptococci and fluoride varnish applications in preschool children from low-and optimal-fluoride areas. Caries Res. 1996;30:347-53.
- [CrossRef] [PubMed] [Google Scholar]
- Influence of thermoplastic retainers on Streptococcus mutans and Lactobacillus adhesion. Am J Orthod Dentofacial Orthop. 2012;141:598-603.
- [CrossRef] [PubMed] [Google Scholar]
- Real-time polymerase chain reaction for detection and quantification of bacteria in periodontal patients. J Periodontol. 2005;76:1542-9.
- [CrossRef] [PubMed] [Google Scholar]


