

Translate this page into:
Marginal ridge alignment and interproximal bone levels: Evaluation of a possible correlation


-
Received: ,
Accepted: ,
How to cite this article: Ramina F, Cremonini F, Pellitteri F, Cavazza M, Lombardo L. Marginal ridge alignment and interproximal bone levels: Evaluation of a possible correlation. APOS Trends Orthod 2023;13:153-60.
Abstract
Objectives:
The purpose of this study was to evaluate whether there is a relationship between the alignment or misalignment of the marginal ridges of posterior teeth and the degree of resorption of interproximal alveolar bone.
Material and Methods:
Intraoral scans and bitewing radiographs were performed on 50 subjects. The bitewing radiographs were analyzed using the VixWinTM Platinum software, measuring the distance between the cementitious junction and the alveolar ridge at the interproximal level for 32 sites for each patient, defined as bitewing scores. The digital models have been oriented in the three dimensions using the Rhinoceros 3D and the linear distance between two contiguous marginal ridges was measured for each interproximal space. To estimate the entity of the correlation, a separate linear regression was performed on the bitewing score for each mouth quadrant. Using the t-test the significance of each estimated coefficient was determinate (P < 0.05).
Results:
In the general comparison including all the analyzed elements, the independent variables are partially correlated with each other. Apparently, the relationship between independent and dependent variables appears to be insignificant. Comparing groups of teeth, however, there seems to be a statistically significant correlation (P < 0.05) between canine and lower first premolar in the XZ and YZ planes and between lower first and second molars in the three dimensions.
Conclusion:
There seems to be a poor correlation at a general level between periodontal conditions of the alveolar bone and the degree of alignment of the marginal ridges.
Keywords
Marginal ridges
Alveolar bone height
Digital analysis
Orthodontic alignment

INTRODUCTION
To evaluate the ideal occlusion according to Andrew’s studies,[1] an objective and biologically valid dental analysis has to be performed in all orthodontic cases. With this purpose, over the years, many indices have been used to assess correct dental alignments, such as the occlusal index,[2] the Peer Assessment Rating index[3] and the American Board of Orthodontics Objective Grading System. The latter provides the achievement of a correct alignment through eight criteria: Dental alignment, marginal ridges, buccolingual inclination, overjet, occlusal relationship, occlusal contacts, root angulation, and interproximal contacts. According to the American Board of Orthodontics (ABO) rationale,[4] the marginal ridges are used to evaluate the posterior teeth correct vertical position. Indeed, if the marginal ridges are at the same relative height, the enamel-cement junctions should theoretically be located at the same level. This should result in a homogeneous bone level between adjacent teeth and adequate occlusal contacts.
The literature over the years has reported conflicting opinions on the real correlation between vertical periodontal bone defects and a correct marginal ridges alignment. In particular, the results of the study reported by Gould and Picton report[5] that teeth with incorrectly shaped contact points had significantly worse periodontal indices than teeth with normal interproximal points. Moreover, in 1930 and 1950 Hirchfeld[6] and Mosteller,[7] respectively, proposed the principle according to which food impaction in the interdental space can be prevented in the presence of proximal contacts’ integrity and the profile of the marginal ridge.
Conversely, some authors seem to indicate that close interproximal contacts are not necessarily conducive to periodontal health. O’Leary et al.[8] reported that in a group of young periodontally healthy dentistry students, there was a high percentage of absent or defective contacts. Likewise, Geiger et al.[9] based on analyzes obtained from their study of single teeth, reported that in both the mandible and the maxilla, teeth that had spacing showed no difference in terms of the degree of destruction of the periodontal tissue o gingival inflammation compared to those with physiological interdental contact; However, they also highlighted that, as the incidence of interproximal spacing increases, periodontal destruction also tended to increase.
Due to the lack of specific literature concerning the possible correlation between marginal ridges and periodontal health, the purpose of this study was to evaluate whether there is a relationship between the alignment or misalignment of the marginal ridges of posterior teeth, and the degree of resorption of interproximal alveolar bone.
MATERIAL AND METHODS
The following prospective study was performed following the 1975 Declaration of Helsinki ethical standards and its later amendments and comparable ethical standards. The study design was approved by the Ethics Committee of the Ferrara University Postgraduate School of Orthodontics (Via Luigi Borsari 46, Ferrara, Italy; approval number 5/2020).
Intraoral scans and bitewing radiographs performed with a dedicated Rinn centering device on both patients’ sides were analyzed in a final study population represented by 50 subjects.
The following inclusion criteria were considered: Complete permanent dentition with good oral health, no previous orthodontic treatment, no relevant medical disorders, and no history of periodontal disease, including in professional oral hygiene recall protocols with 6-month frequency.
In the presence of a missing tooth, the presence of interproximal carious lesions, deciduous teeth, missing interproximal contacts, crowns, or interproximal conservative restorations, the interproximal site was excluded from the study.
Intraoral scans and bitewing radiographs were collected at the same time by one operator (F.R.) in his private practice. The bitewing radiographs were subsequently imported and analyzed using the VixWinTM Platinum software (Kavo, Biberach, Germany). The distance between the amelocementitious junction (CEJ) and the alveolar ridge at the interproximal level (AC) was measured at 8 sites for each hemi-arch, for a total of 32 sites for each patient, defined as bitewing scores. This distance was made parallel to the long axis of the corresponding tooth element in each interproximal surface, for both arches, using a digital caliper with an accuracy of 102 mm [Figure 1]. Each measurement was digitally calibrated by comparison with known landmarks, in this case by measuring the actual length of the bitewing plastic holder and the measurement of the same obtained in the radiograph.[10] The alveolar ridge (AC) was considered to be the most coronal portion of the alveolus at the most apical position of the periodontal ligament space, where it assumed uniformity in width and density.[11]

- Identification of the axes of the dental elements from second molar to canine (a) and subsequent calculation of the CEJ-AC distances (b). CEJ-AC: Cementitious junction-alveolar crest.
Subsequently, the digital models of the arches in stl format were analyzed using the Rhinoceros 3D software (Rhino, Robert McNeel and Associates for Windows, Washington DC, USA), oriented according to the three-dimensional Cartesian axes x, y, and z in a to minimize the subsequent measurement biases relating to the orthogonal components of the distance measurements between the marginal ridges. Subsequently, the central point of each marginal ridge from the second molar to the canine was identified. As long as the canine was concerned, the maximum distal convexity was considered, at the contact point level.
For the same elements, the linear distance between the distal marginal ridge and the mesial ridge of the next tooth was measured for each interproximal space [Figure 2]. The identification of the exact point was based on the definition of marginal ridge given by the ABO, according to which “it is considered as the most occlusal point that is within 1 mm from the contact on the occlusal surface of the adjacent teeth.”[4] These segments were analyzed using the Grasshopper software (Rhino, Washington DC, USA) to quantify the following dimensions:
The absolute size of the segment, in mm.
The length of the projections of the segment in the horizontal plane (xy), to evaluate the discrepancy in the horizontal plane.
The length of the segment projections in the sagittal plane (yz), to evaluate the anterior-posterior discrepancy (absence/presence of the contact point).
The length of the projections of the segment in the frontal plane (xz): Vertical discrepancy.

- Identification of the 8 pairs of segments for each arch, on a model (a) and isolated (b).
All measurements were carried out and repeated three times subsequently by the same operator (F.C.), who remained blinded for the study period.
Statistical analysis
The determination of the patient’s sample size was calculated to obtain a Type 1 error with αlfa = 0.05 and an objective power of 0.8 (and therefore a Type 2 error of 20%), the minimum number to include is 45 patients.
An initial graphical exploratory analysis of both the dependent and independent variables was performed. The dependent variable was defined as the bitewing score for each mouth portion and as an independent variable the three-dimensional distance between the teeth.
With the help of the histogram plot, it was possible to visualize the distribution of each variable and potential outliers.
In addition, the scatterplot between the bitewing score and the distances was inspected, to see the nature of the relationship between each variable set.
Together with the scatterplot, it was calculated the Pearson correlation coefficient to measure the strength of the relation between the variables.
To estimate the entity of the relation, it was performed separate linear regression where the bitewing score for each mouth portion and the distances between the teeth were regressed. Using the t-test, the significance of each estimated coefficient was determined (P <0.05).
Since the distance measure was most of the time correlated with each other; therefore, causing multicollinearity, the rerunning of most of the regression removing the highly correlated variables was performed (absolute value higher than ~0.8).
The measurement error, in terms of repeatability, was estimated using the intra-class correlation (ICC) index. All outcomes had an ICC index >0.94, indicative of excellent sample repeatability.
RESULTS
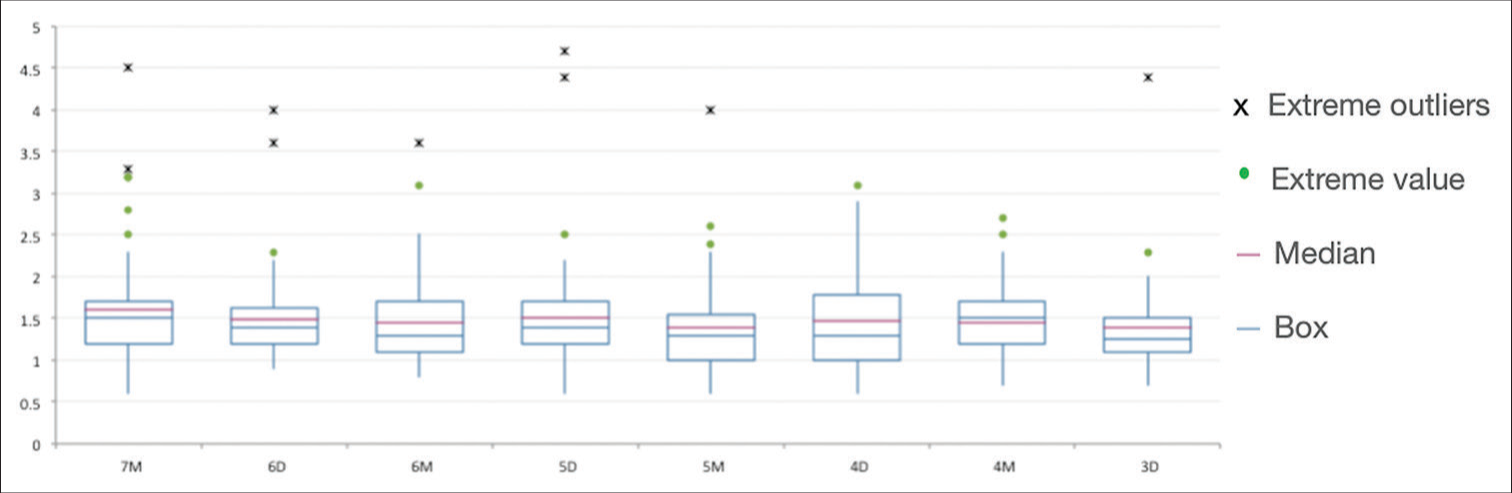
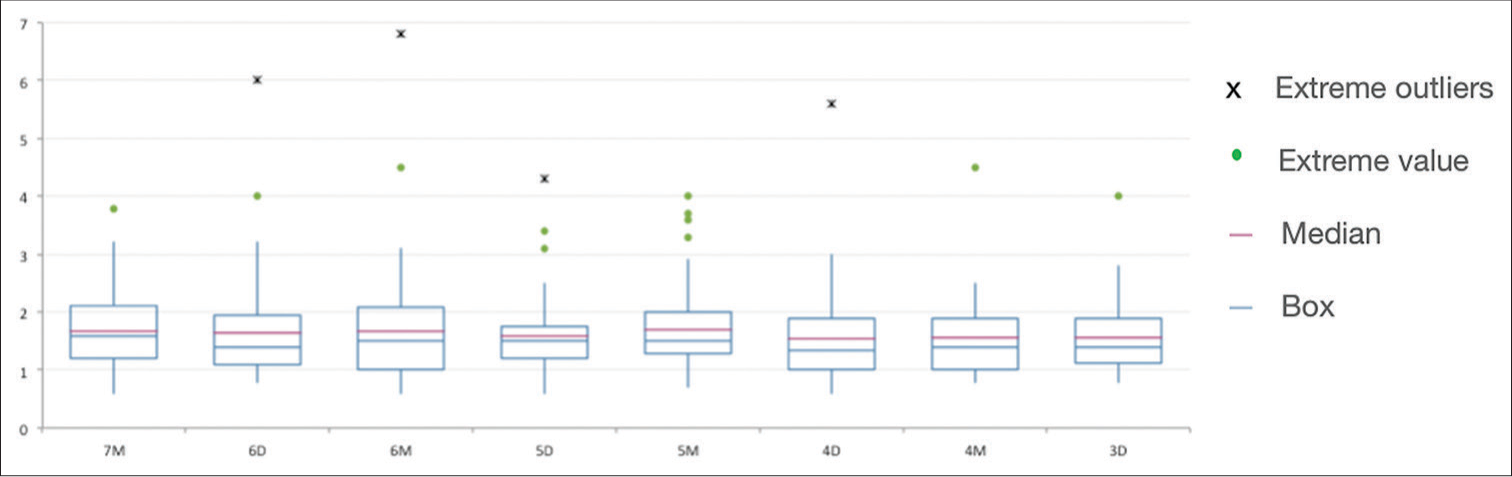
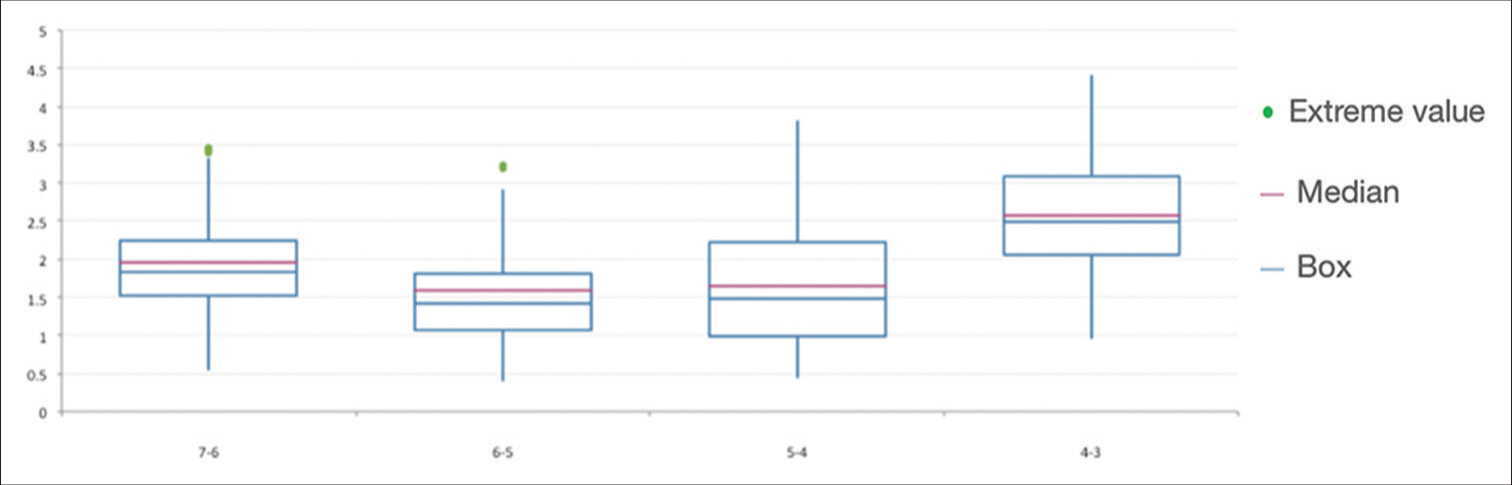
The descriptive statistical analysis of the bitewing scores of the mandibular and maxillary arches is reported, respectively, in [Tables 1 and 2]. For both arches, a separate box plot was performed from the statistical analysis [Figures 3 and 4]. The same was done for the marginal ridges analysis, to obtain a descriptive statistical analysis of all scores for both arches [Tables 3 and 4, Figures 5 and 6].
| Site | n | Mean | Min. | Q1 | Median | Q3 | Max. |
|---|---|---|---|---|---|---|---|
| 7M | 62 | 1.61 | 0.60 | 1.20 | 1.50 | 1.70 | 4.50 |
| 6D | 60 | 1.50 | 0.90 | 1.20 | 1.40 | 1.63 | 4.00 |
| 6M | 62 | 1.45 | 0.80 | 1.10 | 1.30 | 1.70 | 3.60 |
| 5D | 64 | 1.50 | 0.60 | 1.20 | 1.40 | 1.70 | 4.70 |
| 5M | 63 | 1.40 | 0.60 | 1.00 | 1.30 | 1.55 | 4.00 |
| 4D | 62 | 1.47 | 0.60 | 1.00 | 1.30 | 1.78 | 3.10 |
| 4M | 43 | 1.45 | 0.70 | 1.20 | 1.50 | 1.70 | 2.70 |
| 3D | 38 | 1.38 | 0.70 | 1.10 | 1.25 | 1.50 | 4.40 |
n: Number, Q1: 25% percentile, Q3: 75% percentile
| Site | n | Mean | Min. | Q1 | Median | Q3 | Max. |
|---|---|---|---|---|---|---|---|
| 7M | 63 | 1.68 | 0.60 | 1.20 | 1.60 | 2.10 | 3.80 |
| 6D | 63 | 1.65 | 0.80 | 1.10 | 1.40 | 1.95 | 6.00 |
| 6M | 62 | 1.67 | 0.60 | 1.00 | 1.50 | 2.08 | 6.80 |
| 5D | 63 | 1.60 | 0.60 | 1.20 | 1.50 | 1.75 | 4.30 |
| 5M | 64 | 1.71 | 0.70 | 1.30 | 1.50 | 2.00 | 4.00 |
| 4D | 64 | 1.55 | 0.60 | 1.00 | 1.35 | 1.90 | 5.60 |
| 4M | 55 | 1.56 | 0.80 | 1.00 | 1.40 | 1.90 | 4.50 |
| 3D | 50 | 1.56 | 0.80 | 1.13 | 1.40 | 1.90 | 4.00 |
n: Number, Q1: 25% percentile, Q3: 75% percentile
| Site | n | Mean | Min. | Q1 | Median | Q3 | Max. |
|---|---|---|---|---|---|---|---|
| 7-6 | 64 | 1.70 | 0.44 | 1.08 | 1.47 | 2.38 | 3.66 |
| 6-5 | 63 | 1.54 | 0.45 | 1.14 | 1.44 | 1.94 | 3.32 |
| 5-4 | 63 | 1.50 | 0.46 | 0.89 | 1.36 | 1.83 | 4.36 |
| 4-3 | 63 | 2.05 | 0.44 | 2.05 | 2.07 | 2.46 | 3.44 |
n: Number, Q1: 25% percentile, Q3: 75% percentile
| Site | n | Mean | Min. | Q1 | Median | Q3 | Max. |
|---|---|---|---|---|---|---|---|
| 7-6 | 63 | 1.95 | 0.55 | 1.52 | 1.84 | 2.24 | 5.30 |
| 6-5 | 64 | 1.59 | 0.41 | 1.07 | 1.42 | 1.81 | 5.91 |
| 5-4 | 62 | 1.64 | 0.45 | 0.98 | 1.48 | 2.22 | 3.81 |
| 4-3 | 64 | 2.56 | 0.97 | 2.05 | 2.49 | 3.09 | 5.19 |
n: Number, Q1: 25% percentile, Q3: 75% percentile
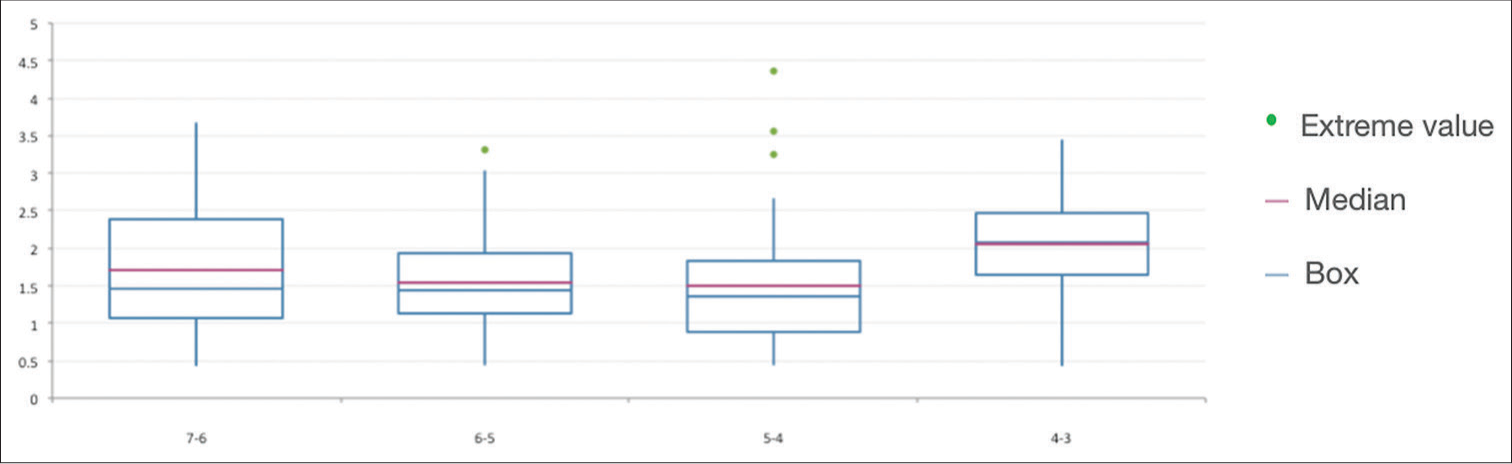
- Box plot of the bitewing scores of the lower arch.
- Box plot of the bitewing scores of the upper arch.
- Box plot of the absolute distances between the marginal ridges in the lower arch.
- Box plot of the absolute distances between the marginal ridges in the upper arch.
The linear model was used to verify the presence of a linear relationship between the distances of the marginal ridges (independent variable) and the bitewing score (dependent variable). In the general comparison including all the analyzed elements, the independent variables (based on the XY, XZ, and YZ axis) are partially correlated with each other, called the collinearity phenomenon. Apparently, the relationship between independent and dependent variables appears to be insignificant [Table 5 and Figure 7].
| Std. Error | t-value | Pr (>|t|) | Significance | |
|---|---|---|---|---|
| XY | −0.073668 | 0.108360 | −0.680 | 0.497 |
| XZ | 0.001257 | 0.070854 | 0.018 | 0.986 |
| YZ | 0.039100 | 0.106576 | 0.367 | 0.714 |

- Regression analysis chart of general comparison.
Comparing groups of teeth, however, there seems to be a statistically significant correlation (P <0.05) between canine and lower first premolar in the XZ (vertical) and YZ (sagittal) planes and between lower first and second molars in the three dimensions: XZ (vertical), YZ (sagittal), and XY (horizontal), but it should be noted that this correlation could be affected by the collinearity phenomena of the variables already described [Figures 8 and 9].

- Regression analysis chart between canine and lower first premolar.

- Regression analysis chart between the first and second lower molars.
The results show an average CEJ-alveolar ridge distance of 1.47 ± 0.07 mm in the mandibular arch and 1.62 ± 0.06 mm in the maxillary arch. However, it should be noted that there is a difference in the average values identified according to the category of teeth considered; in fact, the mandibular sites that presented the greatest bone loss were the molars, with a bitewing score relative to the second molar mesial site of 1.61 ± 0.68 mm and relative to the first molar distal of 1.50 ± 0.55 mm in the mandible. Even in the maxilla, the site that seems to have the highest bitewing scores is the molars, together with a premolar site; especially, 1.68 ± 0.62 mm is recorded for the second molar mesial site [Figure 10]. Analyzing the mean values measured [Figure 11], the sites showing the greatest discrepancy between the marginal ridges appear to be those between the canine and the first premolar, and those between the first and second molars, in both arches.

- Average values graph of maxillary and mandibular bitewing’s score.
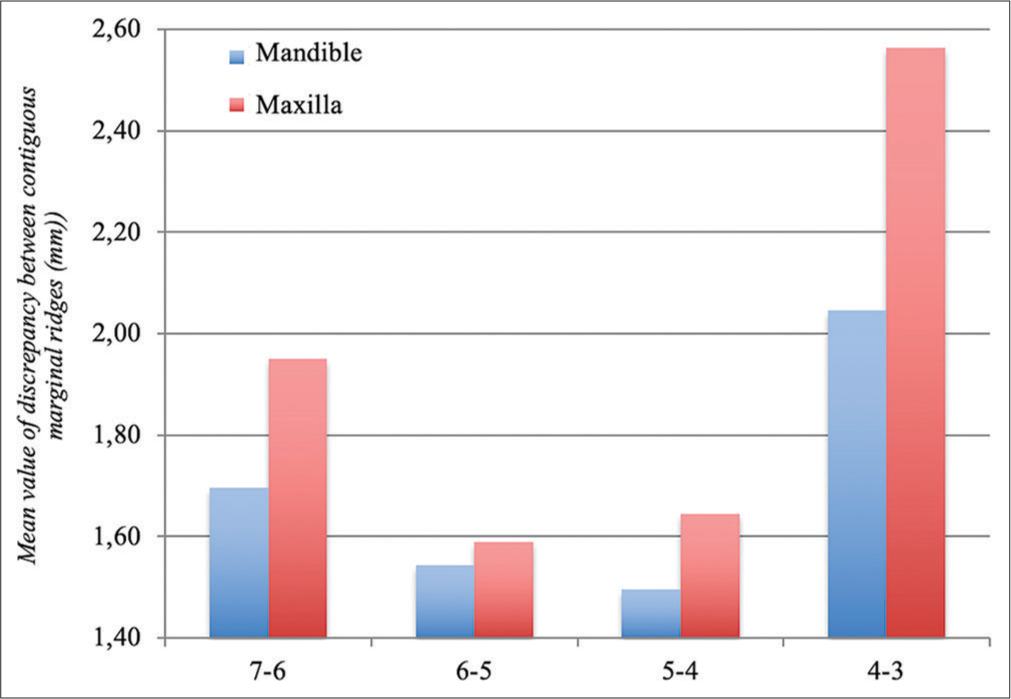
- Discrepancy’s mean value graph between maxillary and mandibular marginal ridges.
DISCUSSION
In the periodontal field, the precision and repeatability of bitewing radiographs for the diagnosis of interproximal bone defects have been evaluated, especially by comparing them with the most modern three-dimensional examinations. A previous study[12] has compared the linear measurements obtainable on the same series of dental arches using cone-beam computed tomography (CBCT), periapical radiographs, and direct measurements obtained by bone sounding with the periodontal probe. The results of this study showed that the three ways of evaluating defects were comparable in terms of repeatability and results obtained. The most commonly used criteria for assessing bone loss are the distance between the CEJ and the bone crest >3 mm.[13] The results obtained from the study by Hausmann et al.[14] showed a mean alveolar crest (AC)-CEJ distance at a radiographic level for 134 sites with no clinical attachment loss of 1.11 ± 0.37 mm at first analysis (range 0.33−2.36 mm) and 1.19 ± 0.34 mm after 18 months (range 0.54−2.62 mm); therefore, these values can be considered indicative of the health of the deep periodontium and the absence of periodontal destruction.
The results of the present study reported in general a low degree of correlation between the bitewing scores and the three-dimensional distances between the marginal ridges. However, evaluating the individual groups of teeth, the statistical analysis showed a slightly significant association for the values of the contact point between the canine and the left lower first premolar (association for horizontal and vertical planes) and the contact point between the lower left molars (association for all the three planes). Indeed, this low degree of association has probably been affected by the collinearity phenomena of the independent variables that emerged during the analysis of the data, however, it seems to emerge that lower molars are the elements that present the least degree of alignment of the marginal ridges; at the same time, the information relating to bone resorption from bitewing radiographs seems to confirm that the greatest interproximal bone loss in the posterior sector is precisely at the contact point between the first and second lower molars. These results could therefore suggest a possible coexistence of the two aspects (misalignment of the marginal ridges and lowering of the interproximal bone level) in the lower molars, even if the evaluation of the possible cause-effect relationships cannot be limited to the evaluation of models and radiographs.
Periodontal literature has attempted on several occasions to investigate the issue of possible relationships with the misalignment of dental elements, often reaching contradictory conclusions. Moreover, in the most recent Consensus of the American Academy of Periodontology,[15] it was shown that some orthodontic conditions, such as crossbite, misalignment/rotation, and crowding of the maxillary, and mandibular anterior sextant, are associated with greater plaque retention and, consequently, greater risk of gingival inflammation, greater probing depth, and loss of bone and clinical attachment. It has been shown that the tooth’s anatomy, and in particular the tooth’s shape and the contact point’s characteristics, affect the height of the interproximal papilla, but few evaluations have been made regarding the relationship with the underlying bone level. Kraus et al.[16] concluded that it is important that marginal ridges of consecutive teeth must be at the same height. Moreover, Prichard[17] concluded that if the marginal ridges of adjacent teeth are not aligned, the creation of a step can encourage food impaction. Finally, Mosteller[7] stated that adjacent marginal ridges should be placed at the same height and identified their misalignment as a significant predisposition to periodontal disease; in his historical review of the etiological factors of periodontal disease, Mosteller[7] has classified a series of factors that can influence the pathogenesis or modifications of periodontal problems, recognizing among these also occlusal misalignments.
Other studies, however, have not found any type of relationship between malocclusion/misalignment and periodontal problems, so much so that Stahl[18] summarized the results of these studies by stating that “the best oral hygiene can be observed in patients with the worst malocclusion, and vice versa.” In this regard, the most important study[19] was carried out to determine whether one of these cofactors, namely, the marginal ridges of the posterior teeth, is a significant factor in the etiology and progression of periodontal disease.
In the current study, a low correlation was identified between the discrepancy of the marginal ridges and the depth of the pocket, the loss of clinical attachment, the accumulation of plaque, the accumulation of tartar, and the state of gingival health. According to the results obtained in this study and from the analysis of the cited literature, a possible future evolution of a similar study should also include a real periodontal analysis, evaluating the minimum periodontal indices (e.g., bleeding on probing, plaque index, and loss of clinical attachment).
Future studies could investigate the mechanisms underlying this apparent relationship, to evaluate any existing cause-effect relationships; a more complete evaluation could include also tests aimed at evaluating the effects on the marginal periodontium (examination of the periodontal indices BoP, PI, loss of CAL). The aid of a CBCT would give the possibility to assess the bone defect in its three-dimensionality, studying possible correlations with ridge misalignment more precisely.
CONCLUSION
From the evaluation of the relationship between the three-dimensional misalignment of the marginal ridges of the posterior teeth and the relative indices of interproximal alveolar bone loss, it is possible to state that:
There seems to be a poor correlation at a general level between periodontal conditions of the alveolar bone and the degree of alignment of the marginal ridges.
The teeth with the greatest degree of misalignment of the marginal ridges are the lower and upper molars.
Observing the individual categories of teeth, there appears to be a slightly positive correlation for the categories relating to the point of contact between the canine and the left lower first premolar (association for horizontal and vertical discrepancies) and for the point of contact between the lower left molars (association for the three planes of space).
Declaration of patient consent
The authors certify that they have obtained all appropriate patient consent.
Conflicts of interest
There are no conflicts of interest.
Financial support and sponsorship
Nil.
References
- The six keys to normal occlusion. Am J Orthod. 1972;62:296-309.
- [CrossRef] [PubMed] [Google Scholar]
- A method of evaluating efficiency of orthodontic treatment. Trans Eur Orthod Soc XX 1974:223-32.
- [Google Scholar]
- The development of the PAR Index (Peer assessment rating): Reliability and validity. Eur J Orthod 1992:125-39.
- [CrossRef] [PubMed] [Google Scholar]
- Objective grading system for dental casts and panoramic radiographs. Am J Orthod Dentofacial Orthop. 1998;114:589-99.
- [CrossRef] [PubMed] [Google Scholar]
- The relation between irregularities of the teeth and periodontal disease. Brit Dent. 1966;121:20-23.
- [Google Scholar]
- The etiology of periodontal disease: A review of current literature. J Periodontol (1930). 1950;21:168-78.
- [CrossRef] [PubMed] [Google Scholar]
- Interproximal contact and marginal ridge relationships in periodontally healthy young males classified as to orthodontic status. J Periodontol. 1975;46:6-9.
- [CrossRef] [PubMed] [Google Scholar]
- Relationship of occlusion and periodontal disease. Part VIII. Relationship of crowding and spacing to periodontal destruction and gingival inflammation. J Periodontol. 1974;45:43-9.
- [CrossRef] [PubMed] [Google Scholar]
- Effect of orthodontic treatment and comorbidity risk factors on interdental alveolar crest level: A radiographic evaluation. Am J Orthod Dentofacial Orthop. 2018;154:375-81.
- [CrossRef] [PubMed] [Google Scholar]
- Relationships between radiographic alveolar bone height and probing attachment level: Data from healthy post-menopausal women. J Clin Periodontol. 2000;27:341-6.
- [CrossRef] [PubMed] [Google Scholar]
- Accuracy of cone beam computed tomography for periodontal defect measurements. J Periodontol. 2006;77:1261-6.
- [CrossRef] [PubMed] [Google Scholar]
- A radiographic study of the prevalence of chronic periodontitis in 14-year-old English schoolchildren. J Clin Periodontol. 1975;2:203-10.
- [CrossRef] [PubMed] [Google Scholar]
- What Alveolar crest level on a bite-wing radiograph represents bone loss? J Periodol. 1991;62:9.
- [CrossRef] [PubMed] [Google Scholar]
- Dental prostheses and tooth-related factors. J Periodontol. 2018;89:223-36.
- [CrossRef] [PubMed] [Google Scholar]
- A technique for treating intrabony pockets based on alveolar process morphology. Dent Clin N Am. 1960;4:85-105.
- [CrossRef] [Google Scholar]
- The need for orthodontic treatment: A periodontist's point of view. Int Dent J. 1975;25:242-7.
- [Google Scholar]
- Role of marginal ridge relationships as an etiologic factor in periodontal disease. J Periodontol. 1978;49:570-5.
- [CrossRef] [PubMed] [Google Scholar]


