

Translate this page into:
Correlation between objective evaluation and subjective evaluation of facial profile in skeletal Type II females

*Corresponding author: Miss Choki, Department of Dentistry, Jigme Dorji Wangchuk National Referral Hospital, Thimphu, Bhutan. chokipema88@icloud.com
-
Received: ,
Accepted: ,
How to cite this article: Choki M, Boonpratham S, Luppanapornlarp S. Correlation between objective evaluation and subjective evaluation of facial profile in skeletal Type II females. APOS Trends Orthod 2021;11:223-8.
Abstract
Objectives:
The objective of this study was to find the cephalometric measurements that correlate with the visual perception.
Materials and Methods:
A total of 250 lateral cephalograms of patients from the year 2016 to 2018 were hand traced and analyzed. Thirty-six hard- and soft-tissue measurements were obtained from the lateral cephalometric analysis. Silhouettes obtained from cephalometric films were rated by 10 orthodontists based on their level of convexity. For each sample, the rating of visual perception was correlated with all the cephalometric (hard and soft) measurements.
Results:
ANB, AF-BF, L1-NB (mm), overjet, anterior maxillary alveolar height, posterior maxillary alveolar height, lower lip to E plane, and H angle were positively correlated with the visual perception. On the contrary, Pg. to N perpendicular and Pg. to NB (mm) were negatively correlated with the visual perception. However, the measurements in the vertical dimensions did not have any significant correlations with visual perception. H angle showed a higher correlation with visual perception than the nasolabial angle, facial contour angle, and lower lip to E plane.
Conclusion:
The agreement between objective cephalometric measurements and subjective visual perception was less than expected. In general, only 27% of the cephalometric measurements had a significant correlation with visual perception. Therefore, orthodontic treatment planning based solely on cephalometric analysis can result in unsatisfactory treatment outcomes. An inclusion of subjective measures such as visual perception in orthodontic diagnosis and treatment planning is necessary.
Keywords
Cephalometric analysis
Visual perception
Skeletal Type II
Correlation

INTRODUCTION
Angle Class II div 1 malocclusion has been recorded as the most common form of malocclusion with the majority of patient seeking help.[1] Patients with Class II malocclusion are esthetically unsatisfied due to its convex facial profile and proclined upper anteriors.[2] Although the three main goals of orthodontic treatment are esthetics, function, and stability, most patients visit orthodontists with a desire to have a better esthetics. Facial assessment is mainly done by assessing patient’s profile view.[3] Over the years, various methods have been used to assess facial esthetics, namely, anthropometry,[4] photometry,[5-7] computer imaging,[8] and cephalometry.[9,10] Cephalometric evaluations were carried out combining many analyses to assist in diagnosis and treatment planning.[11] Similarly, various angles were developed to evaluate facial profile.
Some of the commonly used ones were the H angle,[12] facial contour angle,[13,14] lower lip to E plane,[15] and nasolabial angle.[16] With many analyses in place, finding cephalometric standards depicting the relationship of teeth to cranial bones are crucial to obtain good facial form.[17]
The medical and dental professionals tried to outline and standardize the facial esthetic by creating parameters to act as guidelines in the assessment of facial esthetics. These parameters are known as the norm, measured with the help of cephalometric radiographs. However, it varies with factors such as age, culture, gender, and ethnicity.[18] Due to such difference in preference, cephalometric analysis alone might be insufficient at times, and cephalometric analysis being more objective, can vary from individual’s perception of an ideal. Various recent facts suggest that the understanding of the facial profile desirability has transformed and will last to transform over the period of time. Consequently, the objective of the treatment will change as well. Therefore, it is essential to emphasize on other methods not just solely on the hard tissue and soft-tissue consideration. An orthodontist as a specialist, their perception of facial profile bears an impact on the treatment planning.[19] However, the perception of an orthodontists can vary, which can end up with dissimilar treatment plans and treatment outcomes that are seldom compatible.[20]
The objective measurements are based on findings from cephalogram and the subjective measurements are based on human perception. Considering subjective findings in treatment planning can help clinicians in proper diagnosis and treatment planning.[21] Therefore, visual perception should be an important aspect of orthodontic treatment planning and orthodontist should choose objective measures that correlate to the visual perception. So that it can result in proper diagnosis and treatment planning and the treatment outcome is of satisfaction. Hence, the objective of this study was to find those cephalometric measures that correlate with the visual perception so that using those cephalometric analyses alone could result in a treatment outcome which is of satisfaction to both patient and orthodontist.
MATERIALS AND METHODS
Lateral cephalometric films of 250 individuals were hand traced and analyzed. From 250 films, 56 films that have ANB > 5.69 were selected for this study.[22] The committee for research ethics, Faculty of Dentistry (reference: COA. No.MU-DT/PY-IRB 2017/060.2011) granted ethical approval. Subjects with complete pre-treatment records, non-growing females (20–22 years), skeletal Type II, no previous orthodontic treatment, radiographs with clear hard- and soft-tissue landmarks [Figure 1], and only those radiographs taken from one orthopantomograph (OP, 100, trophy France) were included.
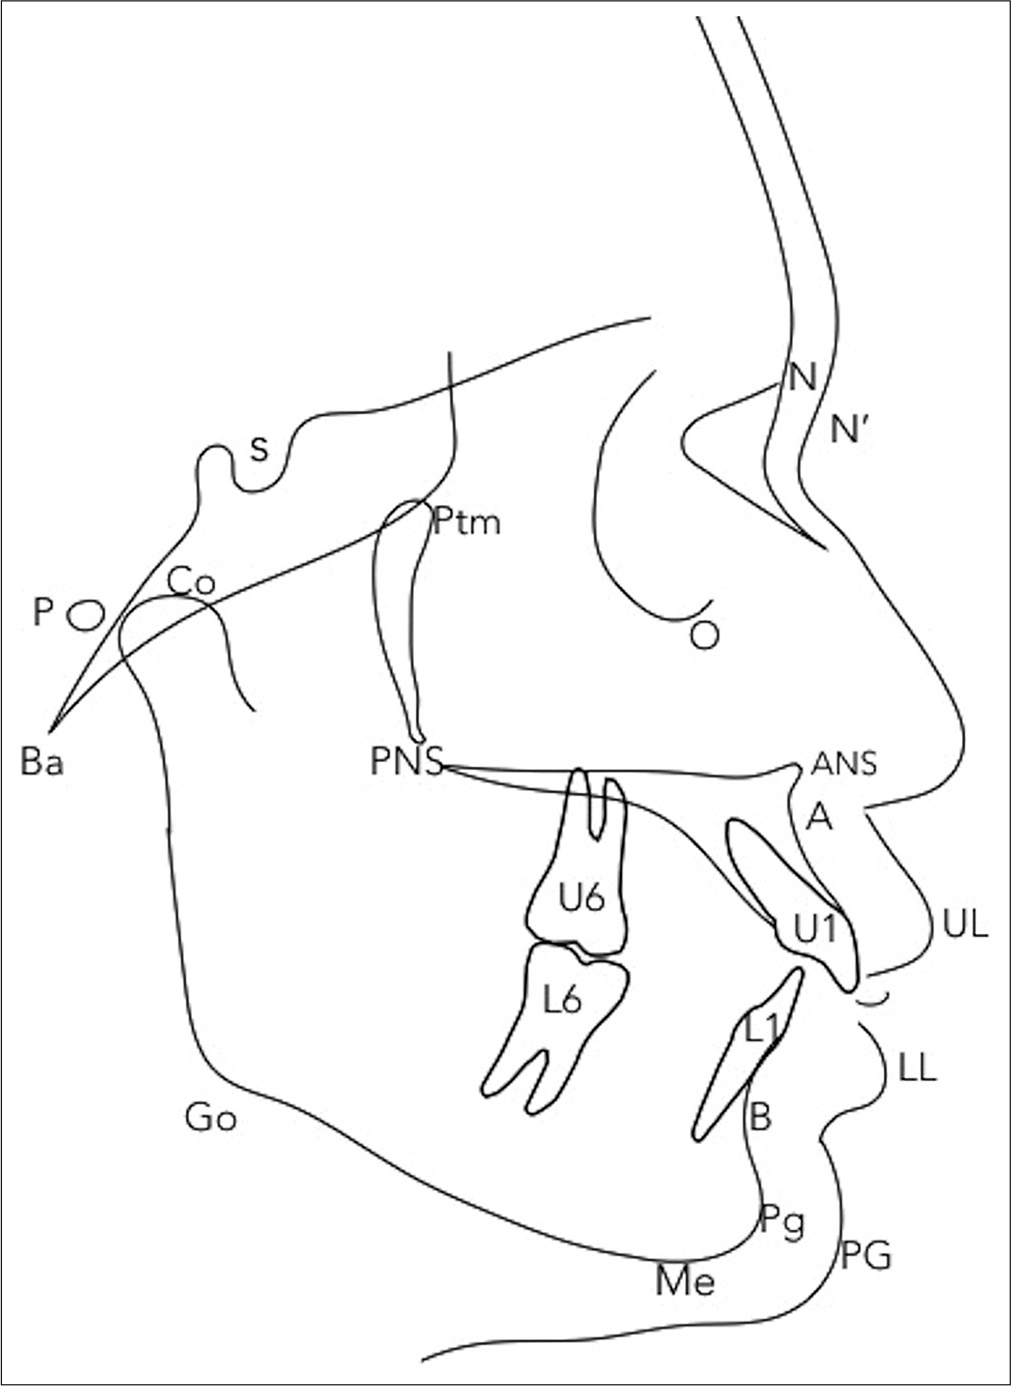
- Cephalometric landmarks.
Visual perception
The principal investigator traced the soft-tissue profile outline and labeled with identification numbers to assess the visual perception. All the traced profiles were transformed into silhouettes and are rated by all the orthodontists of the faculty with same professional background and same working experience. Only 10 orthodontists who had an intrarater reliability <0.7 were selected for the study. Then, the 10 selected specialists rated the silhouettes with score from 1 to 10 based on their level of convexity [Figure 2].
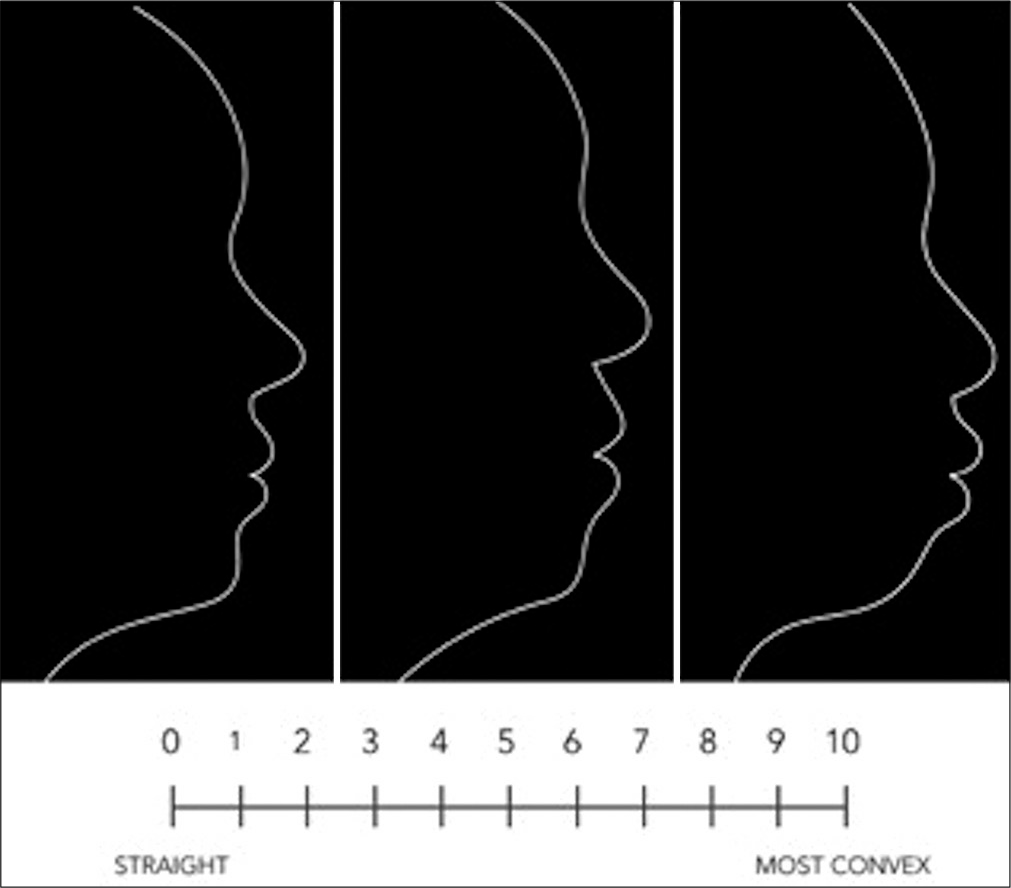
- Guideline for visual perception rating.
Cephalometric analysis
All the cephalometric films fulfilling the inclusion criteria were copied, hand traced, and analyzed on a clear sheet of acetate paper. Thirty-six hard- and soft-tissue measurements were obtained with a protractor and a millimeter ruler.
Statistical analysis
Statistical analysis was carried out using SPSS (IBM Corporation, New York, USA) statistics version 22 for Mac. The power analysis was carried out using correlation sample size calculation, where α: 0.05, β: 0.2, and r: 0.40,[23] and the minimum sample size required for this study was 47. Kolmogorov–Smirnov test was used to test the normality of the data. The correlation between objective cephalometric measurements and subjective visual perception was calculated with Spearman correlation coefficient. P < 0.05 was considered statistically significant for this study.
For the visual perception, the intrarater reliability was assessed with intraclass correlation coefficient. All the orthodontists rated the silhouettes before and after a week to check for the reliability. The intraclass correlation of the specialist ranged from 0.804 to 0.949, showing very good reliability. Similarly, for the cephalometric analysis, the principal investigator analyzed the measurement twice, once before and once after a week to test for the reliability. The intrarater reliability for single measure was 0.893 and for average measure was 0.994, indicating an excellent reliability.
The inter-rater reliability between the orthodontists was also calculated using both Cronbach’s alpha and intraclass correlation at 95% confidence interval. The Cronbach’s alpha was 0.955 and the intraclass correlation was 0.924, both showing an excellent reliability.
RESULTS
The mean and standard deviation of visual perception rating by 10 specialists are given in [Table 1]. Similarly, the mean and standard deviation of all 36 cephalometric measurements along with their correlation with visual perception are given in [Table 2]. ANB, AF-BF, L1-NB (mm), overjet, anterior maxillary alveolar height, posterior maxillary alveolar height, lower lip to E plane, and the H angle were positively correlated with the visual perception. The increase in these cephalometric values was associated with the increase in the facial convexity of skeletal Type II patients. On the contrary, Pg. to N perpendicular and Pg. to NB (mm) were negatively correlated with the visual perception, indicating that the increase in these cephalometric values was associated with the decrease in the facial convexity. From the soft-tissue analysis, H angles had the highest correlation with visual perception when compared to lower lip to E plane, nasolabial angle, and facial contour angle [Figures 3 and 4]. However, the measurements in the vertical dimensions did not have any significant correlations with the visual perception according to this study. In general, only 27% of the cephalometric measurements had a significant correlation with visual perception. The results also indicated skeletal Type II females have slightly convex to convex facial profile, none having a straight or a concave facial profile.
| Visual perception rating | Mean | Standard deviation |
|---|---|---|
| Specialist 1 | 3.89 | 1.26 |
| Specialist 2 | 3.08 | 1.95 |
| Specialist 3 | 4.85 | 1.74 |
| Specialist 4 | 5.64 | 1.58 |
| Specialist 5 | 4.64 | 2.09 |
| Specialist 6 | 5.44 | 1.74 |
| Specialist 7 | 5.60 | 1.95 |
| Specialist 8 | 3.33 | 2.31 |
| Specialist 9 | 4.22 | 1.59 |
| Specialist 10 | 5.03 | 2.14 |
| Measurements | Mean | Standard deviation | Correlation | P-value |
|---|---|---|---|---|
| NsFh | 6.91 | 3.28 | –0.56 | 0.68 |
| NsBa | 129.64 | 4.60 | –0.16 | 0.23 |
| SNA | 83.32 | 3.70 | –0.02 | 0.83 |
| SNB | 75.96 | 3.87 | –0.10 | 0.44 |
| ANB | 7.36 | 1.51 | 0.32 | 0.01 |
| A to N perpendicular | 0.21 | 3.14 | –0.00 | 0.95 |
| Pg. to N perpendicular | –12.85 | 6.31 | –0.27 | 0.04 |
| AF-BF | 11.92 | 4.20 | 0.40 | 0.00 |
| AO-BO | 1.69 | 3.22 | 0.16 | 0.22 |
| SNPg | 76.51 | 4.03 | –0.17 | 0.20 |
| Pg.-NB (mm) | 0.59 | 0.66 | –0.26 | 0.04 |
| CO-A (mm) | 80.69 | 3.73 | 0.11 | 0.41 |
| CO-Gn (mm) | 106.75 | 4.99 | 0.20 | 0.13 |
| NS-MP | 38.10 | 5.69 | 0.20 | 0.12 |
| NS-PP | 8.57 | 3.44 | 0.10 | 0.42 |
| MP-PP | 29.29 | 4.85 | 0.23 | 0.08 |
| FH-FO | 14.18 | 4.04 | 0.13 | 0.32 |
| NS-Gn | 72.75 | 3.55 | 0.23 | 0.07 |
| Mandibular angle | 122.64 | 5.33 | 0.20 | 0.13 |
| PFH/AFH | 65.60 | 4.82 | –0.09 | 0.47 |
| Facial Index | 80.79 | 7.63 | 0.00 | 0.97 |
| U1_NA | 19.60 | 6.76 | 0.01 | 0.93 |
| U1_NA (mm) | 2.12 | 2.16 | 0.07 | 0.60 |
| U1_SN | 103.51 | 8.44 | –0.04 | 0.73 |
| L1-NB | 34.71 | 5.90 | 0.20 | 0.13 |
| L1-NB (mm) | 8.32 | 2.58 | 0.33 | 0.01 |
| L1_Mp | 100.92 | 7.22 | 0.05 | 0.69 |
| IIA | 118.35 | 11.38 | –0.13 | 0.33 |
| Overjet | 3.17 | 1.54 | 0.23 | 0.08 |
| Overbite | 2.60 | 1.23 | –0.08 | 0.52 |
| Ant. Max Alv height | 29.85 | 2.10 | 0.02 | 0.03 |
| Post. Max Alv height | 22.35 | 1.81 | 0.31 | 0.02 |
| Nasolabial angle | 102.57 | 8.80 | –0.16 | 0.22 |
| H angle | 19.96 | 3.07 | 0.70 | 0.00 |
| Lower lip to E plane | 2.25 | 2.40 | 0.46 | 0.00 |
| FCA | 15.57 | 3.74 | 0.13 | 0.32 |
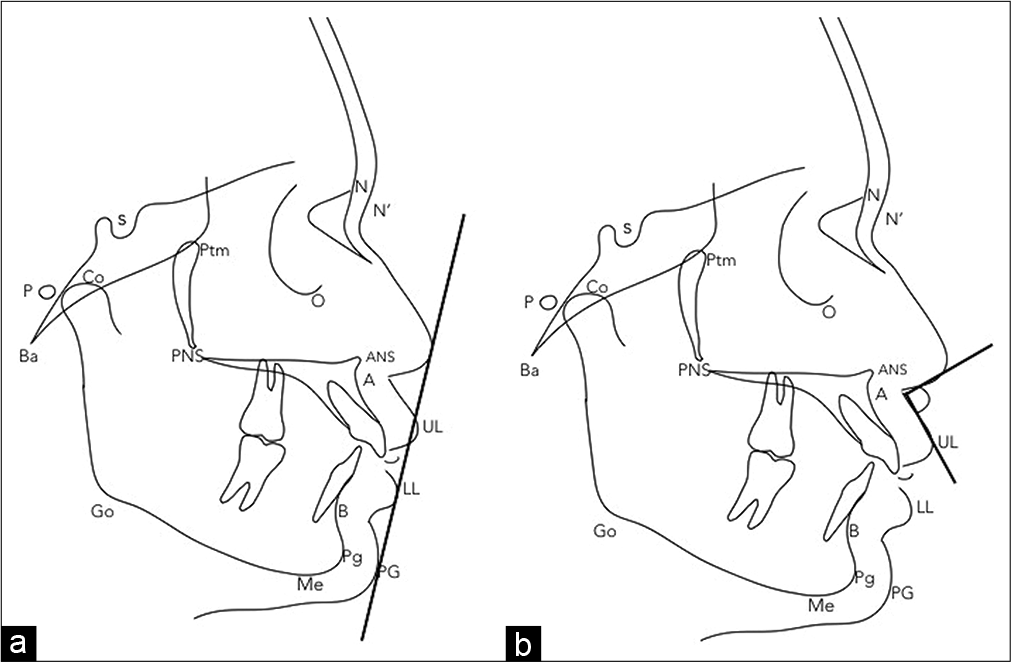
- Soft-tissue measurements; (a) lower lip to E plane, (b) nasolabial angle.

- Soft-tissue measurements; (c) facial contour angle, (d) H angle.
DISCUSSION
An attractive face has become an important component of a person today. Although the improvement of dentoalveolar structures remains the main objective, facial attractiveness has gained popularity in dentistry.[24] Patient’s face looking worse after orthodontic treatment is the worst experience an orthodontist can have and orthodontic treatment should never result in such unfavorable change.[12] Hence, this study was performed to determine the correlation between cephalometric measurements and visual perception in general and to find the soft-tissue analysis that has the best correlation with visual perception in particular.
Our study result indicated that the association between cephalometric measurements and the visual perception was lower than expected. There was only 27% correlation between the cephalometric measurements and the visual perception. However, a study by Oh et al. had a similar finding, with an objective to find correlation between cephalometric measurements and the photographs of patients.[11]
In this study, 36 (hard and soft tissue) cephalometric measurements were correlated with visual perception rating. To make this study, more specific only skeletal Type II females were included. Skeletal Type II is a common malocclusion worldwide with higher treatment needs.[25-27] From the commonly used soft-tissue analyses, the H angle had the highest correlation with the visual perception. This could be due to the facial convexity and anterior chin projection being the key determinant of facial esthetics.[20] As from age 10 to 15, soft-tissue profile undergoes the greatest change and after 25, there is an average decrease in facial convexity, only females aged 20–22 with minimal influence of aging were included in the study.[28]
Many similar studies were conducted in the past, one of which was study by Amer et al., where facial attractiveness based on the photograph was correlated with lateral cephalometric measurement. The only difference being facial attractiveness rated by six laypeople on a scale 1–5 instead of specialist.[17] In a study by Naqvi et al. in 2015, both dental students and layperson were made to evaluate the facial profiles separately. Instead of photos, questionnaires were given to the individuals with a silhouette representing Class I, Class II, Class I bimaxillary, and Class III to find the most attractive face.[29] However, since the orthodontists are concern with the treatment planning, we included 10 specialists to rate the facial profile unlike the previous studies. Similarly, in a study by Huang and Li, facial esthetic rating was done by 10 orthodontists but using a lateral photograph. Their findings suggested that the cephalometric measurements of lip position, incisor position, and chin morphology were highly correlated to facial esthetics.[30] Furthermore, in a study by Marchiori et al., photographic finding was correlated with the soft-tissue measurements such as hold away H line, nasolabial angle, and distance from H line to the nasal tip. The examiners were made to rate the photographs with a scale ranging from good to deficient, based on pleasantness.[31]
However, no studies evaluated the correlations between cephalometric measurements and visual perception of facial profile in skeletal Type II. It was crucial to validate that the cephalometric findings were in line with what individuals perceives visually. The majority of the previous studies were based on photographs, where biases from color, quality of photos, shape, and movement could affect the visual perception rating.[32] Rather, we used silhouettes instead to have a standardized procedure and to have minimal confounding factors for performing visual perception.
CONCLUSION
H angle has a higher correlation with visual perception than the other soft-tissue measurements. Hence, H angle should be used as an objective cephalometric measurement to assess the facial profile of skeletal Type II females.
In general, the agreement between the objective cephalometric measurements and the subjective visual perception was less than expected. Therefore, treatment planning based solely on cephalometric analysis would result in an unsatisfactory treatment outcome.
The measurements in the vertical dimension did not have any significant correlation with the visual perception of facial profile.
Skeletal Type II females have slightly convex to convex facial profile.
Limitations
One of the limitations of this study could be the sample size. The cephalometric films in this study were of those patients who came for orthodontic treatment from the year 2016 to 2018. The sample had been stratified to make it more representative of the adolescent population seeking orthodontic treatment than the general population. Following such stringent inclusion criteria have resulted in 56 samples for this study. Another limitation could be the reliability of the visual perception, as it can vary from person to person and from region to region. Therefore, the findings of this study cannot be generalized to every population. However, this study can be used as a pilot study, and further studies could evaluate the perception of facial profile by orthodontist as well as the patients on a larger population in the future.
Declaration of patient consent
Patient’s consent not required as patients identity is not disclosed or compromised.
Financial support and sponsorship
Nil.
Conflicts of interest
There are no conflicts of interest.
References
- Class II treatment in adults: Comparing camouflage orthodontics, dentofacial orthopedics and orthognathic surgery-a cephalometric study to evaluate various therapeutic effects. J Orofac Orthop. 2009;70:63-91.
- [CrossRef] [PubMed] [Google Scholar]
- Factors influencing soft tissue profile changes following orthodontic treatment in patients with Class II division 1 malocclusion. Prog Orthod. 2016;17:13.
- [CrossRef] [PubMed] [Google Scholar]
- Analysis of the soft tissue facial profile by means of angular measurements. Eur J Orthod. 2008;30:135-40.
- [CrossRef] [PubMed] [Google Scholar]
- Facial asymmetry in healthy North American caucasians. An anthropometrical study. Angle Orthod. 1981;51:70-7.
- [Google Scholar]
- Photography: An anthropometric tool. Am J Phys Anthropol. 1952;10:331-51.
- [CrossRef] [PubMed] [Google Scholar]
- A photometric analysis of the facial profile. Am J Orthod Dentofacial Orthop. 1955;41:453-69.
- [CrossRef] [Google Scholar]
- A quantitative method for the evaluation of the soft tissue facial profile. Am J Orthod. 1959;45:738-51.
- [CrossRef] [Google Scholar]
- Computer treatment estimates in orthodontics and orthognathic surgery. J Clin Orthod. 1989;23:262-8.
- [Google Scholar]
- Soft-tissue changes concurrent with orthodontic tooth movement. Am J Orthod. 1974;66:367-77.
- [CrossRef] [Google Scholar]
- Soft-tissue profile changes in Class II treatment. Am J Orthod. 1977;72:165-75.
- [CrossRef] [Google Scholar]
- Correlations between cephalometric and photographic measurements of facial attractiveness in Chinese and US patients after orthodontic treatment. Am J Orthod Dentofacial Orthop. 2009;136:762.e1-4. discussion 762-3
- [CrossRef] [PubMed] [Google Scholar]
- A soft-tissue cephalometric analysis and its use in orthodontic treatment planning. Part I. Am J Orthod. 1983;84:1-28.
- [CrossRef] [Google Scholar]
- The soft tissue profile, growth and treatment changes. Angle Orthod. 1961;31:105-22.
- [Google Scholar]
- A foundation for cephalometric communication. Am J Orthod. 1960;46:330-57.
- [CrossRef] [Google Scholar]
- Soft tissue cephalometric analysis for orthognathic surgery. J Oral Surg. 1980;38:744-51.
- [Google Scholar]
- Correlations between lateral cephalometric and facial attractiveness of Egyptian adolescents. IOSR J Dent Med Sci. 2015;14:80-8.
- [Google Scholar]
- Orthodontists and patient's aesthetic perception to different types of profiles modified by a computer program. Rev Odontol Mex. 2012;16:164-70.
- [Google Scholar]
- Agreement among orthodontists regarding facial profile In: Dent Press J Orthod. Vol 16. 2011. p. :57-67.
- [CrossRef] [Google Scholar]
- Differences in facial profile and dental esthetic perceptions between young adults and orthodontists. Am J Orthod Dentofacial Orthop. 2014;145:750-6.
- [CrossRef] [PubMed] [Google Scholar]
- n4Studies; Sample Size and Power Calculation for IOS. The Royal Golden Jubilee Ph.D. Program. The Thailand Research Fund and Prince of Songkla University.
- [Google Scholar]
- Biostatistics: A Foundation of Analysis in the Health Sciences New York: John Wiley & Sons; 2013. p. :189-90.
- [Google Scholar]
- Soft tissue cephalometric analysis: Diagnosis and treatment planning of dentofacial deformity. Am J Orthod Dentofacial Orthop. 1999;116:239-53.
- [CrossRef] [Google Scholar]
- Malocclusion severity in Asian men in relation to malocclusion type and orthodontic treatment need. Am J Orthod Dentofacial Orthop. 2005;128:648-52.
- [CrossRef] [PubMed] [Google Scholar]
- Age changes of jaws and soft tissue profile. ScientificWorldJournal. 2014;2014:301501.
- [CrossRef] [PubMed] [Google Scholar]
- Perception of facial profile and orthodontic treatment outcome-patients opinion in treatment plan. Int Dent Med J Adv Res. 2015;1:1-5.
- [CrossRef] [Google Scholar]
- Correlation between objective and subjective evaluation of profile in bimaxillary protrusion patients after orthodontic treatment. Angle Orthod. 2015;85:690-8.
- [CrossRef] [PubMed] [Google Scholar]
- Pleasantness of facial profile and its correlation with soft tissue cephalometric parameters: Perception of orthodontists and lay people. Eur J Dent. 2015;9:352-5.
- [CrossRef] [PubMed] [Google Scholar]
- The eye of the beholder; face recognition and perception. Semin Orthod. 2015;18:229-34.
- [CrossRef] [Google Scholar]


