

Translate this page into:
Mean values of Steiner, Tweed, Ricketts and McNamara analysis in Maratha ethnic population: A cephalometric study
Address for correspondence: Dr. Manan Bharat Atit, Departments of Orthodontics and Dentofacial Orthopedics, Karnavati School of Dentistry, Ahmedabad, Gujarat, India. E-mail: drmananatit@gmail.com
How to cite this article: Atit MB, Deshmukh SV, Rahalkar J, Subramanian V, Naik C, Darda M. Mean values of Steiner, Tweed, Ricketts and McNamara analysis in Maratha ethnic population: A cephalometric study. APOS Trends Orthod 2013;3:137-51.
Abstract
Objectives
Cephalometric norms derived for Caucasian population are routinely used for investigations. As these norms show a great degree of variation when applied to different populations, it becomes necessary to establish the norms for every ethnic group. The present study was designed to derive norms for the Maratha ethnic population, which would be comparable in diagnosis and treatment planning, to the Steiner, Tweed, Ricketts and McNamara cephalometric analysis.
Materials
and Methods: The sample consisted of 60 adult subjects (30 males and 30 females) of Maratha ethnic origin. The age ranged between 18 and 26 years. The cephalograms of the subjects were subjected to Steiner, Tweed, Ricketts and McNamara cephalometric analysis and were complemented by a few additional readings.
Result
The cephalometric norms for Steiner, Tweed, Ricketts and McNamara cephalometric analysis of the Maratha population differed significantly from the Caucasian population. Comparison of our sample with the other ethnic group reaffirmed the need to develop separate standards for different populations.
Conclusion
Therefore, it is legitimate and important for those undertaking orthodontic treatment for patients of Maratha ethnicity to use cephalometric norms for Maratha ethnic population.
Keywords
Cephalometrics
ethnic group
McNamara
Ricketts
Steiner
Tweed

INTRODUCTION
Orthodontics is a combination of art and science and facial esthetics is the reflection of the orthodontist’s artistic intuition. One of the primary goals of the orthodontic treatment is to attain and preserve optimal facial attractiveness. The successful treatment is dependent on careful diagnosis. Cephalometric analysis is an aid in the diagnosis of skeletal and dental problems.[1,2] Radiographic cephalometry has been used extensively to study facial form and to develop norms to aid in orthodontic diagnosis and treatment planning. It is also used to assess treatment progress and craniofacial growth, to predict growth for individual patients and for other tasks in orthodontic research.[3] Commonly used cephalometric analyses are primarily designed to harmonize the position of the teeth with the existing skeletal pattern.
Many cephalometric analyses have been developed to establish norms for ideal facial proportions and occlusion, presenting average measurements of skeletal or dental patterns and their ranges. Since well-established Indian ethnic norms are lacking, norms derived for Caucasian population are routinely used for investigations. As these norms show a great degree of variation when applied to different populations, it becomes necessary to establish the norms for every ethnic group. Indian population comprises of different ethnic groups and races. States in India are created on the basis of languages and not on ethnicity or racial origin. In Maharashtra state as well, there are different ethnic races of which Marathas comprise of 50% of population.[4] With this view in mind, the present study was designed to derive norms for the Maratha ethnic population. The purpose of this study was to evaluate mean measurements for Maratha ethnic adults, which would be comparable in diagnosis and treatment planning, to the Steiner,[5] Tweed,[6,7] Ricketts[8] and McNamara[9] cephalometric analysis. The established norms would be compared with those the Caucasian population and between male and female sample subjects.
AIM AND OBJECTIVES OF THE STUDY
Aim
To evaluate the mean cephalometric values for Steiner, Tweed, Ricketts and McNamara Analysis in Maratha ethnic population.
Objectives
To evaluate the cephalometric features of a Maratha population and to present an organized, comprehensive cephalometric norms for Steiner, Tweed, Ricketts and McNamara cephalometric analysis
To introduce mean values to assess skeletal, dental and soft tissue relationship using Steiner, Tweed, Ricketts and McNamara cephalometric analysis for orthodontic diagnosis
To compare standards that will be derived with the earlier established norms for other population
To identify possible gender difference between the values.
MATERIALS AND METHODS
The study was conducted in the Department of Orthodontics and Dentofacial Orthopedics, Dr. D. Y. Patil Dental College and Hospital, Pimpri, Pune. The sample consisted of 60 adult subjects (30 males and 30 females) of Maratha ethnic origin, selected from the dental students studying at various colleges of the same management in Pune. The age ranged between 18 and 26 years [Figures 1 and 2]. An informed consent was taken from each subject for the study.

- Female subject with pleasing face and acceptable occlusion

- Male subject with pleasing face and acceptable occlusion
The inclusion criteria for the sample selection were as follows:
Subjects should be Maratha ethnic individuals, traced back to two generations
Acceptable, pleasing and preferably straight profiles.
Class I molar relationship on both sides, with normal overjet and overbite with no or minimal crowding or spacing
Good quality Cephalometric records.
The exclusion criteria for the sample selection were as follows:
History of previous orthodontic treatment
Presence of gross abnormal ity or severe crowding
Missing teeth except III molars
Presence of gross facial asymmetry or deformity.
The lateral cephalometric radiographs [Figure 3] were taken on a Planmeca Proline XC Dimax3 X-ray machine in the Department of Oral Medicine Diagnosis and Radiology. Lateral cephalograms of all the sample subjects were taken from the same X-ray machine with the subject in the natural head position (NHP), with teeth in maximum intercuspation and lips in repose. NHP was obtained by asking the subject to look straight ahead such that the visual axis was parallel to the floor. The radiographs were exposed at 80 kV/8 mA for 0.8 s. The film to source distance was 5 ft 2” and the distance between the film and patient’s mid-sagittal plane was 6.”

- Lateral cephalogram
The tracings were done on 75 μm lacquered polyester papers using a 0.03 mm lead pencil. A single operator performed the tracings in a standardized manner to avoid errors due to intra-operator variations.
All the tracings were subjected to Steiner, Tweed, Ricketts and McNamara cephalometric analysis and were complemented by a few additional readings (upper and lower pharynx width) [Figures 4, 5 and 6].[10,11]

- Steiner analysis

- Tweed and Ricketts analysis

- McNamara analysis
Statistical analysis
The measurements were statistically analyzed by calculating their means and standard deviations (SD). Then the means of Maratha ethnic population were compared with means of Caucasian population with the help of Student’s unpaired t-test. A comparison was also made between males and females within the present study.
RESULTS
Different races in the World have different ethnic origins. Hard and soft-tissue cephalometric parameters are different for different ethnic groups. Hence, cephalometric norms of one population can’t be applied to other groups. Hence, an attempt is made to establish norms for population of Maratha.
Various skeletal, dental and soft- tissue parameters (Steiner, Tweed, Ricketts and McNamara analysis) were checked to establish the cephalometric norms of Maratha population.
To check the operator’s reliability and reproducibility, 10 males and 10 females’ lateral cephalograms were randomly selected and retraced after an interval of 1 week. Statistically, there was no significant difference found in mean, standard of deviation, t value and P value. It indicated that there was no significant intra-examiner variability found.
Steiner analysis
Comparison of Maratha female and Caucasian population
Table 1 and Graph 1 depict the comparison of Steiner analysis parameters between Maratha Female and Caucasian population.
| Parameter | Caucasians standard values (mean±SD) | Female maratha population values (mean±SD) | t value | P value |
|---|---|---|---|---|
| SNA (in degrees) | 82.0±2.0 | 84.1±2.9 | 3.85 | <0.01*** |
| SNB (in degrees) | 80.0±2.0 | 82.0±2.7 | 4.17 | <0.01*** |
| SND (in degrees) | 76.0±2.0 | 78.6±2.6 | 5.38 | <0.01*** |
| ANB (in degrees) | 2.0±2.0 | 2.1±1.9 | 0.28 | 0.77* |
| Go-Gn to SN (in degrees) | 32.0 | 28.1±3.6 | −6.03 | <0.01*** |
| U1 to N- A (in mm) | 4.0 | 8.3±2.6 | 8.94 | <0.01*** |
| U1 to N-A (in degrees) | 22.0 | 27.0±5.8 | 4.72 | <0.01*** |
| L1 to N-B (in mm) | 4.0 | 7.4±1.7 | 10.73 | <0.01*** |
| L1 to N-B (in degrees) | 25.0 | 31.1±4.3 | 7.78 | <0.01*** |
| L1 to U1 (in degrees) | 131.0 | 120.2±6.1 | −9.76 | <0.01*** |
| Occl to S-N (in degrees) | 14.0 | 14.4±3.4 | 0.637 | 0.52* |

- Steiner analysis: Comparison of Caucasians std. values of parameters with ‘Female’ Maratha population
There was highly significant difference seen in SNA angle (84.1 ± 2.9°), SNB angle (82.0 ± 2.7°), SND angle (78.6 ± 2.6°), U1 to N-A angle (27.0 ± 5.8°), L1 to N-B angle (31.1 ± 4.3°), Go – Gn to SN (28.1 ± 3.6°), U1 to L1 angle (120.2 ± 6.1°), U1 to N-A distance (8.3 ± 2.6 mm), L1 to N-B distance (7.4 ± 1.7 mm) in Maratha than Caucasians (P < 0.01).
No significant difference was seen in ANB angle (2.1 ± 1.9°) and Occlusal plane to S-N (14.4 ± 3.4°) in Maratha than Caucasians (P > 0.05).
Comparison of Maratha male and Caucasian population
Table 2 and Graph 2 depict the comparison of Steiner analysis parameters between Maratha Male and Caucasian population.
| Parameter | Caucasians standard values (mean±SD) | Male maratha population values (mean±SD) | t value | P value |
|---|---|---|---|---|
| SNA (in degrees) | 82.0±2.0 | 84.3±3.0 | 4.19 | <0.01*** |
| SNB (in degrees) | 80.0±2.0 | 82.8±2.7 | 5.67 | <0.01*** |
| SND (in degrees) | 76.0±2.0 | 80.2±2.5 | 9.11 | <0.01*** |
| ANB (in degrees) | 2.0±2.0 | 1.5±2.6 | −1.06 | 0.29* |
| Go-Gn to SN (in degrees) | 32.0 | 23.5±4.2 | −9.44 | <0.01*** |
| U1 to N-A (in mm) | 4.0 | 7.9±3.7 | 5.75 | <0.01*** |
| U1 to N-A (in degrees) | 22.0 | 29.5±8.3 | 4.94 | <0.01*** |
| L1 to N-B (in mm) | 4.0 | 6.1±2.6 | 4.50 | <0.01*** |
| L1 to N-B (in degrees) | 25.0 | 24.7±5.8 | −0.25 | 0.80* |
| L1 to U1 (in degrees) | 131.0 | 124.5±9.2 | −3.84 | <0.01*** |
| Occl to S-N (in degrees) | 14.0 | 9.4±2.9 | −8.42 | <0.01*** |

- Steiner analysis: Comparison of Caucasians std. values of parameters with ‘Male’ Maratha population
There was highly significant difference seen in SNA angle (84.3 ± 3.0°), SNB angle (82.8 ± 2.7°), SND angle (80.2 ± 2.5°), U1 to N-A angle (29.5 ± 8.3°), Go – Gn to SN (23.5 ± 4.2°), U1 to L1 angle (124.5 ± 9.2°), U1 to N-A distance (7.9 ± 3.7 mm), L1 to N-B distance (6.1 ± 2.6 mm), Occlusal plane to S-N (9.4 ± 2.9°) in Maratha than Caucasians (P < 0.01).
No significant difference was seen in ANB angle (1.5 ± 2.6°) and L1 to N-B angle (24.7 ± 5.8°) in Maratha than Caucasians (P > 0.05).
Comparison of Maratha male and Maratha female population
Table 3 and Graph 3 depict the comparison of Steiner analysis parameters between Maratha male and Maratha female population.
| Parameter | Male maratha population values (mean±SD) | Female maratha population values (mean±SD) | t value | P value |
|---|---|---|---|---|
| SNA (in degrees) | 84.3±3.0 | 84.1±2.9 | −0.26 | 0.79* |
| SNB (in degrees) | 82.8±2.7 | 82.0±2.7 | −1.06 | 0.29* |
| SND (in degrees) | 80.2±2.5 | 78.6±2.6 | −2.39 | <0.05** |
| ANB (in degrees) | 1.5±2.6 | 2.1±1.9 | 1.02 | 0.31* |
| Go-Gn to SN (in degrees) | 23.5±4.2 | 28.1±3.6 | 4.08 | <0.01*** |
| U1 to NA (in mm) | 7.9±3.7 | 8.3±2.6 | 0.44 | 0.66* |
| U1 to N-A (in degrees) | 29.5±8.3 | 27.0±5.8 | −1.33 | 0.18* |
| L1 to N-B (in mm) | 6.1±2.6 | 7.4±1.7 | 2.22 | <0.05** |
| L1 to N-B (in degrees) | 24.7±5.8 | 31.1±4.3 | 4.84 | <0.01*** |
| L1 to U1 (in degrees) | 124.5±9.2 | 120.2±6.1 | −2.15 | <0.05** |
| Occl to S-N (in degrees) | 9.4±2.9 | 14.4±3.4 | 6.00 | <0.01*** |

- Steiner analysis: Comparison of parameter values between ‘Male’ and ‘Female’ Maratha population
The Go – Gn to SN angle, L1 to N-B distance and Occlusal plane to S-N angle were highly significantly lesser in Maratha male than Maratha female (P < 0.01).
There was also significant difference between SND angle, L1 to N-B distance, U1 to L1 angle between Maratha male and Maratha female (P < 0.05).
No statistical significant difference was seen in SNA angle, SNB angle, ANB angle, U1 to N-A angle, U1 to N-A distance between Maratha male and Maratha female (P > 0.05).
Tweed analysis
Comparison of Maratha female and Caucasian population
Table 4 and Graph 4 depict the comparison of Tweed analysis parameters between Maratha Female and Caucasian population.
| Parameter (in degrees) | Caucasians standard values (mean±SD) | Female maratha population values (mean±SD) | t value | P value |
|---|---|---|---|---|
| FMA | 25.0 | 23.9±4.3 | −1.35 | 0.18* |
| FMIA | 65.0 | 57.2±5.8 | −7.39 | <0.01*** |
| IMPA | 90.0 | 98.2±5.2 | 8.56 | <0.01*** |

- Tweed analysis: Comparison of Caucasians std. values of parameters with ‘Female’ Maratha population
There was highly significant difference seen in FMIA angle (57.2 ± 5.8°), IMPA angle (98.2 ± 5.2°) in Maratha than Caucasians (P < 0.01).
No significant difference was seen in FMA angle (23.9 ± 4.3°) in Maratha (P > 0.05).
Comparison of Maratha male and Caucasian population
Table 5 and Graph 5 depict the comparison of Tweed analysis parameters between Maratha male and Caucasian population.
| Parameter (in degrees) | Caucasians standard values (mean±SD) | Male maratha population values (mean±SD) | t value | P value |
|---|---|---|---|---|
| FMA | 25.0 | 20.8±6.2 | −3.70 | <0.01*** |
| FMIA | 65.0 | 63.9±7.2 | −0.81 | 0.42* |
| IMPA | 90.0 | 95.3±6.2 | 4.62 | <0.01*** |

- Tweed analysis: Comparison of Caucasians std. values of parameters with ‘Male’ Maratha population
There was highly significant difference seen in FMA angle (20.8 ± 6.2°) and IMPA angle (95.3 ± 6.2°) in Maratha than Caucasians (P < 0.01).
No significant difference was seen in FMIA angle (63.9 ± 7.2°) in Maratha (P > 0.05).
Comparison of Maratha male and Maratha female population
Table 6 and Graph 6 depict the comparison of Tweed analysis parameters between Maratha male and Maratha female population.
| Parameter (in degree) | Male maratha population values (mean±SD) | Female maratham population values (mean±SD) | t value | P value | |
|---|---|---|---|---|---|
| FMA | 20.8±6.2 | 23.9±4.3 | 2.26 | <0.05** | |
| FMIA | 63.9±7.2 | 57.2±5.8 | −4.00 | <0.01*** | |
| IMPA | 95.3±6.2 | 98.20±5.2 | 1.97 | 0.053* | |

- Tweed analysis: Comparison of parameter values between ‘Male’ and ‘Female’ Maratha population
There was highly significant difference see in FMIA angle between Maratha male and Maratha female population (P < 0.01).
Significant difference was seen in FMA angle (P < 0.05), whereas no significant difference was seen in FMIA angle between Maratha male and Maratha female population (P > 0.05).
McNamara analysis
Comparison of Maratha female and Caucasian population
Table 7 and Graph 7 depict the comparison of McNamara analysis parameters between Maratha female and Caucasian population.
| Parameter | Caucasians standard values (mean±SD) | Female maratha population values (mean±SD) | t value | P value |
|---|---|---|---|---|
| N perpendicular to | 1.0 | 0.9±2.8 | −0.12 | 0.89* |
| A (in mm) | ||||
| N perpendicular to | −2.0 | −1.2±4.5 | 0.94 | 0.35* |
| pogonion (in mm) | ||||
| Facial axis (in | 0±3.5 | 0.4±4.7 | 0.46 | 0.64* |
| degrees) | ||||
| Mandibular plane | 22.0±4.0 | 24.9±4.9 | 3.22 | <0.01*** |
| (in degrees) | ||||
| Eff. Max. Length | 93.5 | 92.9±4.2 | −0.74 | 0.46* |
| (CO-A) (in mm) | ||||
| Eff. Mand. Length | 121.5 | 121.1±5.7 | −0.35 | 0.72* |
| (CO-Gn) (in mm) | ||||
| Maxillofacial | 28.0 | 28.2±3.9 | 0.28 | 0.78* |
| differential (in mm) | ||||
| Lower ant. Face | 66.0 | 66.9±4.5 | 1.05 | 0.29* |
| height (in mm) | ||||
| U1 to point A | 5.0 | 8.6±2.1 | 9.53 | <0.01*** |
| distance (in mm) | ||||
| L1 to A-Pog line | 1.0±2.0 | 5.5±1.7 | 14.42 | <0.01*** |
| distance (in mm) | ||||
| Naso labial angle | 102.0±8.0 | 101.5±11.5 | −0.22 | 0.82* |
| (in degrees) | ||||
| Cant of upper lip | 14.0±8.0 | 15.5±2.3 | 3.58 | <0.01*** |
| (in degrees) | ||||
| Upper pharynx | 17.0 | 17.1±1.7 | 0.44 | 0.66* |
| (in mm) | ||||
| Lower pharynx | 12.0 | 12.1±1.7 | 0.43 | 0.67* |
| (in mm) |

- Mc Namara analysis: Comparison of Caucasians std. values of parameters with ‘Female’ Maratha population
There was highly significant difference in Mandibular plane angle (24.9 ± 4.9°), U1 to point A distance (8.6 ± 2.1 mm), L1 to A-Pog distance (5.5 ± 1.7 mm), Cant of the upper lip (15.5 ± 2.3°) in Maratha than Caucasians (P < 0.01).
No significant difference was seen in facial axis angle (0.4 ± 4.7°), maxillary length (CO – A) (92.9 ± 4.2 mm), mandibular length (CO – Gn) (121.1 ± 5.7 mm), lower anterior facial height (66.9 ± 4.5 mm), maxillofacial differential (28.2 ± 3.9 mm), N perpendicular to A (0.9 ± 2.8 mm), N perpendicular to Pog (−1.2 ± 4.5 mm), nasolabial angle (101.5 ± 11.5°), upper pharynx width (17.1 ± 1.7 mm), lower pharynx width (12.1 ± 1.7 mm) in Maratha than Caucasians (P > 0.05).
Comparison of Maratha male and Caucasian population
Table 8 and Graph 8 depict the comparison of McNamara analysis parameters between Maratha male and Caucasian population.
| Parameter | Caucasians standard values (mean±SD) | Male maratha population values (mean±SD) | t value | P value |
|---|---|---|---|---|
| N perpendicular to A (in mm) | 1.0 | 0.1±4.2 | −1.20 | 0.23* |
| N perpendicular to pogonion (in mm) | −2.0 | −0.2±6.7 | 1.46 | 0.15* |
| Facial axis (in degrees) | 0±3.5 | 3.7±4.4 | 4.67 | <0.01*** |
| Mandibular plane (in degrees) | 22.0±4.0 | 21.9±6.9 | −0.10 | 0.91* |
| Eff. Max. Length (CO-A) (in mm) | 93.5 | 98.8±5.7 | 5.02 | <0.01*** |
| Eff. Mand. Length (CO-Gn) (in mm) | 121.5 | 130.1±7.2 | 6.54 | <0.01*** |
| Maxillofacial differential (in mm) | 28.0 | 31.3±6.0 | 3.05 | <0.01*** |
| Lower ant. Face height (in mm) | 66.0 | 72.6±8.6 | 4.19 | <0.01*** |
| U1 to point A distance (in mm) | 5.0 | 7.8±2.6 | 5.75 | <0.01*** |
| L1 to A Pog line distance (in mm) | 1.0±2.0 | 4.1±2.6 | 6.63 | <0.01*** |
| Naso labial angle (in degrees) | 102.0±8.0 | 98.1±9.5 | −2.25 | <0.05** |
| Cant of upper lip (in degrees) | 8.0±8.0 | 11.2±2.8 | 6.29 | <0.01*** |
| Upper pharynx (in mm) | 17.0 | 17.5±1.8 | 1.57 | 0.53* |
| Lower pharynx (in mm) | 12.0 | 12.2±1.3 | 0.84 | 0.40* |

- Mc Namara analysis: Comparison of Caucasians std. values of parameters with ‘Female’ Maratha population
There was highly significant difference in U1 to point A distance (7.8 ± 2.6 mm), L1 to A-Pog distance (4.1 ± 2.6 mm), Cant of upper lip (11.2 ± 2.8°), facial axis angle (3.7 ± 4.4°), maxillary length (CO – A) (98.8 ± 5.7 mm), mandibular length (CO – Gn) (130.1 ± 7.2 mm), lower anterior facial height (72.6 ± 8.6 mm), maxillofacial differential (31.3 ± 6.0 mm) in Maratha than Caucasians (P < 0.01).
The nasolabial angle (101.5 ± 11.5°) was significantly decreased in Maratha than Caucasians (P < 0.05).
No significant difference was seen in mandibular plane angle (24.9 ± 4.9°), N perpendicular to A (0.9 ± 2.8 mm), N perpendicular to Pog (−1.2 ± 4.5 mm), upper pharynx width (17.1 ± 1.7 mm), lower pharynx width (12.1 ± 1.7 mm) in Maratha than Caucasians (P > 0.05).
Comparison of Maratha male and Maratha female population
Table 9 and Graph 9 depict the comparison of McNamara analysis parameters between Maratha male and Maratha female population.
| Parameter | Male maratha population values (mean±SD) | Female maratha population values (mean±SD) | t value | P value |
|---|---|---|---|---|
| N perpendicular to | 0.1±4.2 | 0.9±2.8 | 0.93 | 0.35* |
| A (in mm) | ||||
| N perpendicular to | −0.2±6.7 | −1.2±4.5 | −0.70 | 0.48* |
| pogonion (in mm) | ||||
| Facial axis | 3.7±4.4 | 0.4±4.7 | −2.83 | <0.01*** |
| (in degrees) | ||||
| Mandibular plane | 21.9±6.9 | 24.9±4.9 | 1.94 | 0.057* |
| (in degrees) | ||||
| Eff. Max. Length | 98.8±5.8 | 92.9±4.2 | −4.50 | <0.01*** |
| (CO-A) (in mm) | ||||
| Eff. Mand. Length | 130.1±7.2 | 121.1±5.7 | −5.37 | <0.01*** |
| (CO-Gn) (in mm) | ||||
| Maxillofacial | 31.3±6.0 | 28.2±3.9 | −2.40 | <0.05** |
| differential (in mm) | ||||
| Lower ant. Face | 72.6±8.6 | 66.9±4.5 | −3.23 | <0.01*** |
| height (in mm) | ||||
| U1 to point A | 7.8±2.6 | 8.6±2.1 | 1.41 | 0.16* |
| distance (in mm) | ||||
| L1 to A Pog line | 4.1±2.6 | 5.5±1.7 | 2.43 | <0.05** |
| distance (in mm) | ||||
| Naso labial angle | 98.1±9.5 | 101.5±11.5 | 1.27 | 0.20* |
| (in degrees) | ||||
| Cant of upper lip | 11.2±2.8 | 15.5±2.3 | 6.52 | <0.01*** |
| (in degrees) | ||||
| Upper pharynx | 17.5±1.9 | 17.1±1.7 | −0.88 | 0.38* |
| (in mm) | ||||
| Lower pharynx | 12.2±1.3 | 12.1±1.7 | −0.17 | 0.86* |
| (in mm) |

- Mc Namara analysis: Comparison of parameter values between ‘Male’ and ‘Female’ Maratha population
There was highly significant difference seen in facial axis angle, maxillary length, mandibular length, lower anterior facial height, Cant of upper lip between Maratha male and Maratha female population (P < 0.01).
Significant difference was seen in maxillofacial differential and L1 to A-Pog distance (P < 0.05), whereas no significant difference was seen in mandibular plane angle, N perpendicular to A distance, N perpendicular to Pog distance, U1 to point A distance, nasolabial angle, upper pharynx width, lower pharynx width between Maratha male and Maratha female population (P > 0.05).
Ricketts analysis
Comparison of Maratha female and Caucasian population
Table 10 and Graph 10 depict the comparison of Ricketts analysis parameters between Maratha female and Caucasian population.
| Parameter | Caucasians standard values (mean±SD) | Female maratha population values (mean±SD) | t value | P value |
|---|---|---|---|---|
| Facial axis (in degrees) | 90.0±3.5 | 90.0±4.7 | 0.46 | 0.64* |
| Facial depth (in degrees) | 87.8±3.6 | 89.6±2.2 | 4.5 | <0.01*** |
| M.P. angle (in degrees) | 26.0±4.5 | 24.9±4.9 | −1.27 | 0.21* |
| Convexity of point A (in mm) | 2.0±2.0 | 1.63±2.5 | −0.81 | 0.42* |
| L1 to A-Pog (in degrees) | 22.0±4.0 | 29.9±4.1 | 10.53 | <0.01*** |
| L1 to A-Pog (in mm) | 1.0±2.0 | 5.5±1.7 | 14.42 | <0.01*** |
| Lip to E-plane (in mm) | −2.0±2.0 | −0.5±1.5 | −0.81 | 0.42* |
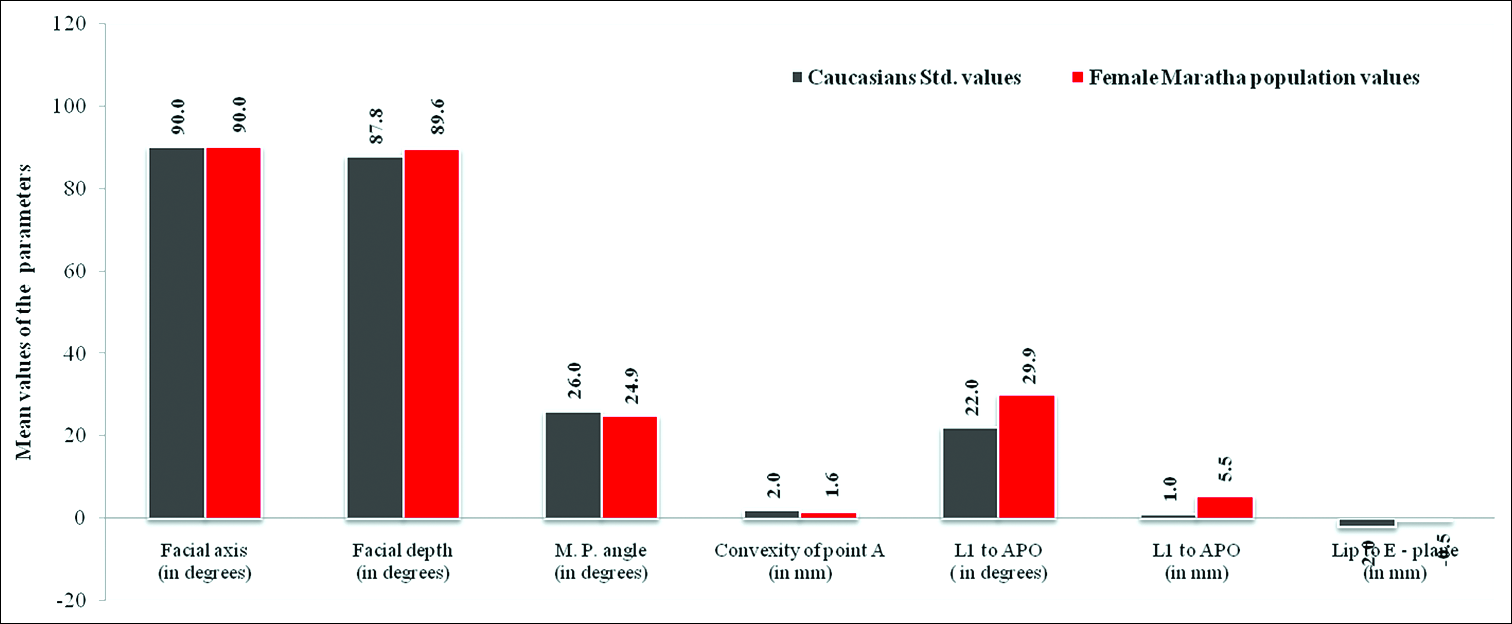
- Ricketts analysis: Comparison of Caucasians std. values of parameters with ‘Female’ Maratha population
The facial depth (89.6 ± 2.2°), L1 to A-Pog angle (29.9 ± 4.1°), L1 to A-Pog distance (5.5 ± 1.7 mm) were highly significantly increased in Maratha population than Caucasians (P < 0.01).
No significant difference was seen in facial axis angle (90.0 ± 4.7°), lower lip to E-plane (−0.5 ± 1.5 mm), convexity of point A (1.63 ± 2.5 mm), mandibular plane angle (24.9 ± 4.9°) in Maratha population than Caucasians (P > 0.05).
Comparison of Maratha male and Caucasian population
Table 11 and Graph 11 depict the comparison of Ricketts analysis parameters between Maratha male and Caucasian population.
| Parameter | Caucasians standard values (mean±SD) | Male maratha population values (mean±SD) | t value | P value |
|---|---|---|---|---|
| Facial axis (in degrees) | 90.0±3.5 | 93.7±4.4 | 4.67 | <0.01*** |
| Facial depth (in degrees) | 87.8±3.6 | 90.1±3.2 | 3.95 | <0.01*** |
| M.P. angle (in degrees) | 26.0±4.5 | 21.9±6.9 | −3.27 | <0.01*** |
| Convexity of point A (in mm) | 2.0±2.0 | 0.4±2.8 | −3.02 | <0.01*** |
| L1 to A-Pog (in degrees) | 22.0±4.0 | 26.1±5.4 | 4.18 | <0.01*** |
| L1 to A-Pog (in mm) | 1.0±2.0 | 4.1±2.6 | 6.63 | <0.01*** |
| Lip to E- plane (in mm) | −2.0±2.0 | −1.7±3.0 | 0.48 | 0.63* |

- Ricketts analysis: Comparison of Caucasians std. values of parameters with ‘Male’ Maratha population
The facial depth (90.1 ± 3.2°), L1 to A-Pog angle (26.1 ± 5.4°), L1 to A-Pog distance (4.1 ± 2.6 mm), facial axis angle (93.7 ± 4.4°), convexity of point A (0.4 ± 2.8 mm), mandibular plane angle (21.9 ± 6.9°) were highly significantly increased in Maratha population than Caucasians (P < 0.01).
No significant difference was seen in the lower lip to E-plane (−1.7 ± 3.0 mm), in Maratha population than Caucasians (P > 0.05).
Comparison of Maratha male and Maratha female population
Table 12 and Graph 12 depict the comparison of Ricketts analysis parameters between Maratha male and Maratha female population.
| Parameter | Male maratha population values (mean±SD) | Female maratha population values (mean±SD) | t value | P value |
|---|---|---|---|---|
| Facial axis (in degrees) | 93.7±4.4 | 90.0±4.7 | −2.83 | <0.01*** |
| Facial depth (in degrees) | 90.1±3.2 | 89.6±2.2 | −0.74 | 0.45* |
| M.P. angle (in degrees) | 21.9±6.9 | 24.9±4.9 | 1.94 | 0.057* |
| Convexity of point A (in mm) | 0.4±2.8 | 1.6±2.5 | 1.74 | 0.08* |
| L1 to A-Pog (in degrees) | 26.1±5.4 | 29.9±4.1 | 3.06 | <0.01*** |
| L1 to A-Pog (in mm) | 4.1±2.6 | 5.5±1.7 | 2.43 | <0.05** |
| Lip to E-plane (in mm) | −1.7±3.0 | −0.5±1.5 | 2.03 | <0.05** |

- Ricketts analysis: Comparison of parameter values between ‘Male’ and ‘Female’ Maratha population
Highly significant difference was seen in Facial axis angle and L1 to A-Pog angle (P < 0.01), whereas significant difference was seen in L1 to A-Pog distance and lower lip to E-plane (P < 0.05) between Maratha male and Maratha female population.
Established standard norms for Maratha population
Tables 13,14,15 and 16 depict the established standard norms of Steiner, Tweed, Ricketts and McNamara Analysis for Maratha male and Maratha female population with and without correction of linear measurements for magnification error.
| Parameter | Established standard. Norms for maratha population (mean±SD) | |||
|---|---|---|---|---|
| Male | Female | Male | Female | |
| SNA (in degrees) | 84.3±3.0 | 84.1±2.9 | 84.3±3.0 | 84.1±2.9 |
| SNB (in degrees) | 82.8±2.7 | 82.0±2.7 | 82.8±2.7 | 82.0±2.7 |
| SND (in degrees) | 80.2±2.5 | 78.6±2.6 | 80.2±2.5 | 78.6±2.6 |
| ANB (in degrees) | 1.5±2.6 | 2.1±1.9 | 1.5±2.6 | 2.1±1.9 |
| Go-Gn to SN (in degrees) | 23.5±4.2 | 28.1±3.6 | 23.5±4.2 | 28.1±3.6 |
| U1 to N-A (in mm) | 7.9±3.7 | 8.3±2.6 | 6.9±3.7 | 7.2±2.6 |
| U1 to N-A (in degrees) | 29.5±8.3 | 27.0±5.8 | 29.5±8.3 | 27.0±5.8 |
| L1 to N-B (in mm) | 6.1±2.6 | 7.4±1.7 | 5.3±2.6 | 6.4±1.7 |
| L1 to N-B (in degrees) | 24.7±5.8 | 31.1±4.3 | 24.7±5.8 | 31.1±4.3 |
| L1 to U1 (in degrees) | 124.5±9.2 | 120.2±6.1 | 124.5±9.2 | 120.2±6.1 |
| Occl to S-N (in degrees) | 9.4±2.9 | 14.4±3.4 | 9.4±2.9 | 14.4±3.4 |
Magnification error was that of 13%, SD = Standard deviation; SNA = Sella Nasion Point A;SNB = Sella Nasion Point B; SND = Sella Nasion Point D; N-A = Nasion Point A; N-B = Nasion Point B; SN = Sella Nasion
| Parameter (in degrees) | Established standard norms for maratha population (mean±SD) | |||
|---|---|---|---|---|
| Male | Female | Male | Female | |
| FMA | 20.8±6.2 | 23.9±4.3 | 20.8±6.2 | 23.9±4.3 |
| FMIA | 63.9±7.2 | 57.2±5.8 | 63.9±7.2 | 57.2±5.8 |
| IMPA | 95.3±6.2 | 98.2±5.2 | 95.3±6.2 | 98.2±5.2 |
Magnification error was that of 13%, SD = Standard deviation; FMA = Frankfort mandibular angle; FMIA = Frankfort mandibular incisor angle; IMPA = Incisor mandibular plane angle
| Parameter | Established standard norms for maratha population (mean±SD) | |||
|---|---|---|---|---|
| Male | Female | Male | Female | |
| N perpendicular to A (in mm) | 0.1±4.2 | 0.9±2.8 | 0.0±4.2 | 0.8±2.8 |
| N perpendicular to pogonion (in mm) | −0.2±6.7 | −1.2±4.5 | −0.1±6.7 | −1.0±4.5 |
| Facial axis (in degrees) | 3.7±4.4 | 0.4±4.7 | 3.7±4.4 | 0.4±4.7 |
| Mandibular plane (in degrees) | 21.9±6.9 | 24.9±4.9 | 21.9±6.9 | 24.9±4.9 |
| Eff. Max. Length (CO-A) (in mm) | 98.8±5.8 | 92.9±4.2 | 85.9±5.8 | 80.8±4.2 |
| Eff. Mand. Length (CO-Gn) (in mm) | 130.1±7.2 | 121.1±5.7 | 113.2±7.2 | 105.3±5.7 |
| Maxillofacial differential (in mm) | 31.3±6.0 | 28.2±3.9 | 27.2±6.0 | 24.5±3.9 |
| Lower ant. Face height (in mm) | 72.6±8.6 | 66.9±4.5 | 63.2±8.6 | 58.2±4.5 |
| U1 to point A distance (in mm) | 7.8±2.6 | 8.6±2.1 | 6.8±2.6 | 7.5±2.1 |
| L1 to A Pog line distance (in mm) | 4.1±2.6 | 5.5±1.7 | 3.6±2.6 | 4.8±1.7 |
| Naso labial angle (in degrees) | 98.1±9.5 | 101.5±11.5 | 98.1±9.5 | 101.5±11.5 |
| Cant of upper lip (in degrees) | 11.2±2.8 | 15.5±2.3 | 11.2±2.8 | 15.5±2.3 |
| Upper pharynx (in mm) | 17.5±1.9 | 17.1±1.7 | 15.2±1.9 | 14.8±1.7 |
| Lower pharynx (in mm) | 12.2±1.3 | 12.1±1.7 | 10.6±1.3 | 10.5±1.7 |
Magnification error was that of 13%, SD = Standard deviation
| Parameter | Established standard norms for maratha population (mean±SD) | |||
|---|---|---|---|---|
| Male | Female | Male | Female | |
| Facial axis (in degrees) | 93.7±4.4 | 90.0±4.7 | 93.7±4.4 | 90.0±4.7 |
| Facial depth (in degrees) | 90.1±3.2 | 89.6±2.2 | 90.1±3.2 | 89.6±2.2 |
| M.P. angle (in degrees) | 21.9±6.9 | 24.9±4.9 | 21.9±6.9 | 24.9±4.9 |
| Convexity of point A (in mm) | 0.4±2.8 | 1.6±2.9 | 0.3±2.8 | 1.4±2.9 |
| L1 to A-Pog (in degrees) | 26.1±5.4 | 29.9±4.1 | 26.1±5.4 | 29.9±4.1 |
| L1 to A-Pog (in mm) | 4.1±2.6 | 5.5±1.7 | 3.6±2.6 | 4.8±1.7 |
| Lip to E- plane (in mm) | −1.7±3.0 | −0.5±1.5 | −1.5±3.0 | −0.4±1.5 |
Magnification error was that of 13%, SD = Standard deviation; MP = Mandibular plane angle
DISCUSSION
In the modern biological model, variation is the theme and the clinician’s task is to achieve the desired facial and dental outcomes within the ability of individual to adapt physiologically to the morphologic changes. India is one of the largest countries in Asia with four different zones – East, West, North and South. All four zones have different people having different facial characteristics. Over the centuries, Indian has received large groups of people of different ethnical and cultural origins. Thus, these will lead to dispersion of different ethnic groups in Indian population. Current requirements of present ability and demand on good impressive appearance make it mandatory to study the pattern of ethnic groups.[3]
An attempt was made to establish the cephalometric norms of Maratha population by studying the facial features and also to compare the cephalometric norms of Maratha Males and Females. Most cephalometric analyses are designed for orthodontic diagnosis and treatment planning. As well-established norms for specific ethnic groups are lacking, one had to rely on Caucasian norms for the assessment of orthodontic patient. This seems to be logically inappropriate because any two different population groups have several dissimilarities in their dentofacial structures as is evident from the present study.
There was increase in SNA angle, SNB angle, SND angle, Facial axis angle and Facial depth angle and decrease in Mandibular plane angle and FMA angle in Marathas than Caucasians. Marathas had proclined and forwardly placed upper and lower incisors, which was indicative of bimaxillary protrusion as compared with Caucasians. Marathas had increased cant of upper lip and protrusive upper and lower lips when compared with Caucasians. Maratha males had tendency toward horizontal growth pattern of the mandible than females. Maratha females had more proclined lower incisors than males.
The findings of our study also in agreement with the study done on Lucknow Hindus,[12] Indo-Aryans,[3] North and South Indians[13] and on Marathi.[14]
Also our study shows the following findings:
Mean values of various parameters of Maratha population are more different in the dental parameters than the skeletal parameters compiled by Steiner for Caucasian population. Increased values of the angular and linear measurements of maxillary incisor to NA and mandibular incisor to NB line suggest proclined incisors and forward placement of incisors in relation to NA and NB line.
(a) The FMA has been found close to Tweeds. In the Maratha group mean being 23.9 for females and 20.8 in males with SD 4.3-6.2. (b) The IMPA was found to be more than the values observed in Caucasians suggesting Marathas have more proclined mandibular incisors. (c) Any increase or decrease in FMA was compensated by an inverse change in the IMPA to maintain good facial harmony
Ricketts analysis tries to orient face and mandible to the cranium. Great emphasis has been given to growth and facial growth pattern with Maratha Males having more tendencies towards horizontal growth pattern.
All the above mentioned studies showed that most of cephalometric norms for Indian population are significantly different from the Caucasian norms, which we use routinely.
Clinical implications of the study
Most cephalometric analyses are designed for orthodontic diagnosis and treatment planning. As well-established norms for specific ethnic groups are lacking, one had to rely on Caucasian norms for the assessment of orthodontic patient. This seems to be logically inappropriate because any two different population groups have several dissimilarities in their dentofacial structures, as is evident from the present study. For instance; SNA angle, SNB angle, SND angle and Facial axis angle: Facial depth angle, mandibular plane angle and FMA angle for the Maratha group differed significantly from that of the Caucasians. The upper and lower incisors are much more proclined in the Maratha group and the face is slightly more convex.
The established norms (with or without magnification error) can be used as a reference guideline to know the extent of discrepancy in a particular case of Maratha ethnic population. It will depend on the cephalogram obtained for that case is with a magnification error or is of “True size.” The values proposed by us should prove to be more relevant for the Maratha ethnic population. However, it must be emphasized that the cephalometric evaluation should be correlated with clinical observations to arrive at proper conclusions.
Suggestions for future studies
The future studies can be planned with the following considerations:
A similar study can be carried out using a larger sample size. A large sample will allow a better representation of the test population
The landmark identification error can be minimized by averaging multiple measurements done by a number of operators
Advent of cone-beam computed tomography allows for the 3D reconstruction of the dentofacial structures. Hence norms for ethnic population could be derived in the 3 dimensional plane of space.
CONCLUSION
The present study was done on population of Maratha indicates that their facial pattern is not similar to Caucasians
However, this population has a predominant tendency toward horizontal growth pattern of the mandible and this is more so in case of males
This population also has bimaxillary dentoalveolar protrusion.
Comparison of our sample with other ethnic group reaffirmed the need to develop separate standards for different populations. Therefore, it is legitimate and important for those undertaking orthodontic treatment of Maratha ethnicity to use cephalometric norms for Maratha ethnic population.
At the same time, one needs to acknowledge, as stated by McNamara and Ellis, that “… infinite combinations of dentoskeletal and soft-tissue relationships are possible to arrive at a face that is well-balanced.”
Source of Support:
Nil.
Conflict of Interest:
None declared.
References
- Variations in facial relationships; their significance in treatment and prognosis. Am J Orthod. 1948;34:812-40.
- [Google Scholar]
- Use of cephalometrics as an aid to planning and assessing orthodontic treatment. Report of a case. Am J Orthod. 1960;46:721.
- [Google Scholar]
- Cephalometric appraisal of the craniofacial pattern in Indo-Aryans. J Indian Orthod. 1995;26:43-8.
- [Google Scholar]
- “Marathas”. Available from: http://www.everyculture.com/wc/Germany-to-Jamaica/Marathas (accessed )
- [Google Scholar]
- The Frankfort-mandibular plane angle in orthodontic diagnosis, classification, treatment planning, and prognosis. Am J Orthod Oral Surg. 1946;32:175-230.
- [Google Scholar]
- The Frankfort-mandibular incisor angle (FMIA) in orthodontic diagnosis, treatment planning and prognosis. Angle Orthod. 1954;24:121-69.
- [Google Scholar]
- Planning treatment on the basis of the facial pattern and an estimate of its growth. Angle Orthod. 1957;27:14-37.
- [Google Scholar]
- Stiener analysis, rickets analysis, McNamara analysis, tweed analysis In: Jacobson A, Jacobson R, eds. Radiographic Cephalometry from Basics to 3-D Imaging. Canada: Quintessence Publishing Co., Inc.; 2006. p. :71-98.:113-98.
- [Google Scholar]
- Landmarks, variables and norms of various numerical cephalometric analyses – Cephalometric morphologic and growth data references In: Athanasiou AE, ed. Orthodontic Cephalometry. Thessaloniki: Mosby Wolfe; 1995. p. :269-74.:280-74.
- [Google Scholar]
- Cephalometric study of the dentofacial complex of North Indians. Angle Orthod. 1969;39:22-8.
- [Google Scholar]
- An establishment of skeletal and soft tissue norms for Indian Marathi population and relating it with the perception of balanced profiles by lay person. J Indian Orthod. 2008;42:33-40.
- [Google Scholar]


