

Translate this page into:
Transversal craniofacial development between skeletal maturation stages: A multi-center posteroanterior cephalometric study

*Corresponding author: Türkan Sezen Erhamza, Department of Orthodontics, Kırıkkale University, Kırıkkale, Turkey. dt.turkansezen@gmail.com
-
Received: ,
Accepted: ,
How to cite this article: Erhamza TS, Akan B, Ciğerim SÇ, Korkmaz YN, Ünver FN. Transversal craniofacial development between skeletal maturation stages: A multi-center posteroanterior cephalometric study. APOS Trends Orthod 2022;12:44-52.
Abstract
Objectives:
The aim of this study is to evaluate the dentofacial transversal norms according to the stages of skeletal maturation in growing Turkish individuals and to determine differences between the genders.
Materials and Methods:
In our multi-centered, cross-sectional retrospective study, in which transversal measurements were made according to skeletal maturation stages (SMSs), posteroanterior radiographs of 572 individuals (292 female, 280 male) with skeletal and dental Class I relationships and good occlusion were examined at the age range of 7–18 years. SMSs were determined using Björk, Grave and Brown hand-wrist radiography. A linear regression model was used for changes of transversal measurements between SMSs, and t-test was used to determine transverse changes between the genders.
Results:
There was no statistically significant difference between females and males in cranial, facial, and nasal width values up to SMS 5. In maxillary, mandibular, maxillary intermolar, and mandibular intermolar width measurements, males had higher values in most stages of skeletal maturation compared to females. Apart from nasal width and maxillomandibular ratio values in females, the regression model in which transversal measurements were dependent variables, and SMS were independent variables was found to be significant. According to cumulative growth percentages, the growth completion in transversal measurements occurred earlier in females.
Conclusion:
Transversal measurements determined according to the stages of skeletal maturation can be a guide for orthodontists in the clinic to determine values that deviate from normal.
Keywords
Posteroanterior radiographs
Skeletal maturation
Transverse dimensions

INTRODUCTION
Cephalometric radiographs are frequently used in the evaluation of craniofacial complex, diagnosis of malocclusions and anomalies, treatment planning, treatment plan effects, and monitoring of growth and development.[1] Ricketts defines cephalometry by the 4C principle. According to this principles, cephalometric provides the ability to classify the position of the jaws, alveolus, and teeth at the skeletal and dental (classified), whether the current state of the individual is pathological, physiological or anatomical (characterized), differences between individuals or changes between different ages of the individual (compared), and to transfer the current state of the individual to the individual, his surroundings, and other colleagues (communicated).[2]
Cephalometric radiographs are very important in evaluating the craniofacial complex; however, lateral cephalometric X-rays can provide information about skeletal, dental, and soft tissue morphology and relationships in the sagittal direction, while information about skeletal and dentoalveolar relationships in the transversal direction cannot be obtained. For this purpose, posterior cephalometric radiographs can be used.[1] This enables the evaluation of the width and angular relationship of dental arches with bone bases, evaluation of the relationship of bilateral osseous and dental structures in vertical size, evaluation of the width and transverse position of the maxilla and mandible, determination of the width of the nasal cavity, analysis of vertical and transverse facial asymmetries, and evaluation of transversal difference and crossbite between the lower and upper molar.
A growing child is a moving target because growth occurs at different times and different rates for each child. The shape and morphological features of the face change during growth. Most researchers used chronological age information to determine the transversal facial dimensions of the child, which vary with growth.[3-7] However, chronological age does not provide enough information to explain development progress in a growing child.[8] Evaluation of skeletal maturation can better explain individual variations related to the timing and intensity of growth.[9]
Several well-known craniofacial growth studies have generally determined dentofacial dimensions using chronological age as longitudinal.[7,10,11] Studies using skeletal maturation are quite small.[9] Hwang et al.,[9] in their study of the Korean population, they determined transversal measurements according to the stages of skeletal maturation. Since it is a study conducted in individuals living in a single region in Korea, it can be considered limited in terms of creating a norm value for the entire Korean population.
In a study conducted by Uysal and Sari in the Turkish population, posterior cephalometric norm values were determined in individuals with minimal crowding with Class I occlusion, but the sample was made up of adult individuals.[6] Yavuz et al. showed longitudinal transversal changes in individuals between the ages of 10 and 14 with a clinically acceptable occlusion, but chronological age was again used as a determining factor.
The aim of this study is to (A) determine posterior cephalometric norms according to skeletal maturation stages (SMSs) obtained from hand-wrist radiographs in growing individuals with skeletal and dental Class I occlusion and minimal crowding, (B) compare transversal dimensions between male and female, and (C) determine the correlation between transversal measurements. The null hypothesis “transversal measurements obtained from posteroanterior radiography do not differ between skeletal growth stages.”
MATERIALS AND METHODS
Individuals who applied to X University (n = 189), Y University (n = 108), Z University (184), and T University (n = 91), Faculty of Dentistry Department of Orthodontics between 2012 and 2018 and whose hand-wrist, posteroanterior and cephalometric radiographs were taken for diagnostic purposes were evaluated for our cross-sectional retrospective multi-centered study. This study was approved by the NonInvasive Research Ethics Committee of Y University (Decision No: 668, Date: 12.05.2020). By analyzing the difference of cranial width in SMSs in our study, for the included 292 females’ statistical power was 1.00 (100%) with an effect size of d = 0.53 and a type-1 error rate of 0.05. For 280 males, statistical power was determined as 0.85 (85%), with an effect size of d = 0.24 and a type-1 error rate of 0.05. The package program “G Power 3.1.9.2” was used for the calculation.
The individuals included in our study have skeletal and dental Class I relationship (ANB angle between 0° and 4°), no skeletal asymmetry and posterior cross-bite, minimal crowding of <3 mm, no diastema, no orthodontic treatment, no systemic disorder and developmental delay that may affect bone development., no congenital or acquired malformation in the hand-wrist, jaw, face and cervical vertebra region, and no radiographs with artifacts and distortions that may prevent clear evaluations.
Five hundred and seventy two individuals (292 female, average age 11.98 ± 2.65; 280 male, average age 13 ± 2.58) with an average age of 12.48 ± 2.66 in the 6–18 age range were included in the study.
All radiographs were taken under standard conditions such as the distance between the radiograph and porionic axis, source of radiation. The images were taken so that the Frankfurt horizontal plane was parallel to the ground, with the teeth in maximum intercuspation and the lips in a resting position. All radiographs were taken by experienced operators. The posteroanterior radiographs were acquired using different panoramic units in each faculties, adjusting linear readings to the actual subject values according to the width of the metal bar [Figure 1]. The posteroanterior transversal measurements were analyzed on Dolphin Software (Dolphin Imaging 11.8 Premium, Chatsworth, CA). All measurements were determined as follows [Figure 1]:
Cranial width: The width between the most lateral points on the cranium.
Facial width: The width between the most lateral points on the zygomatic arch.
Nasal width: The width between the most lateral points on the nasal cavity.
Maxillary width: The width between jugal process which is the intersection of the outline of the maxillary tuberosity and zygomatic buttress.
Maxillary intermolar width: The width between the most lateral points on the buccal surfaces of the maxillary first molar crowns.
Mandibular intermolar width: The width between the most lateral points on the buccal surfaces of the mandibular first molar crowns.
Mandibular width: The width between the antegonial notches.
Maxillomandibular width ratio: Maxillary width divided by mandibular width.
Maxillomandibular width difference: Maxillary width takes away from mandibular width.
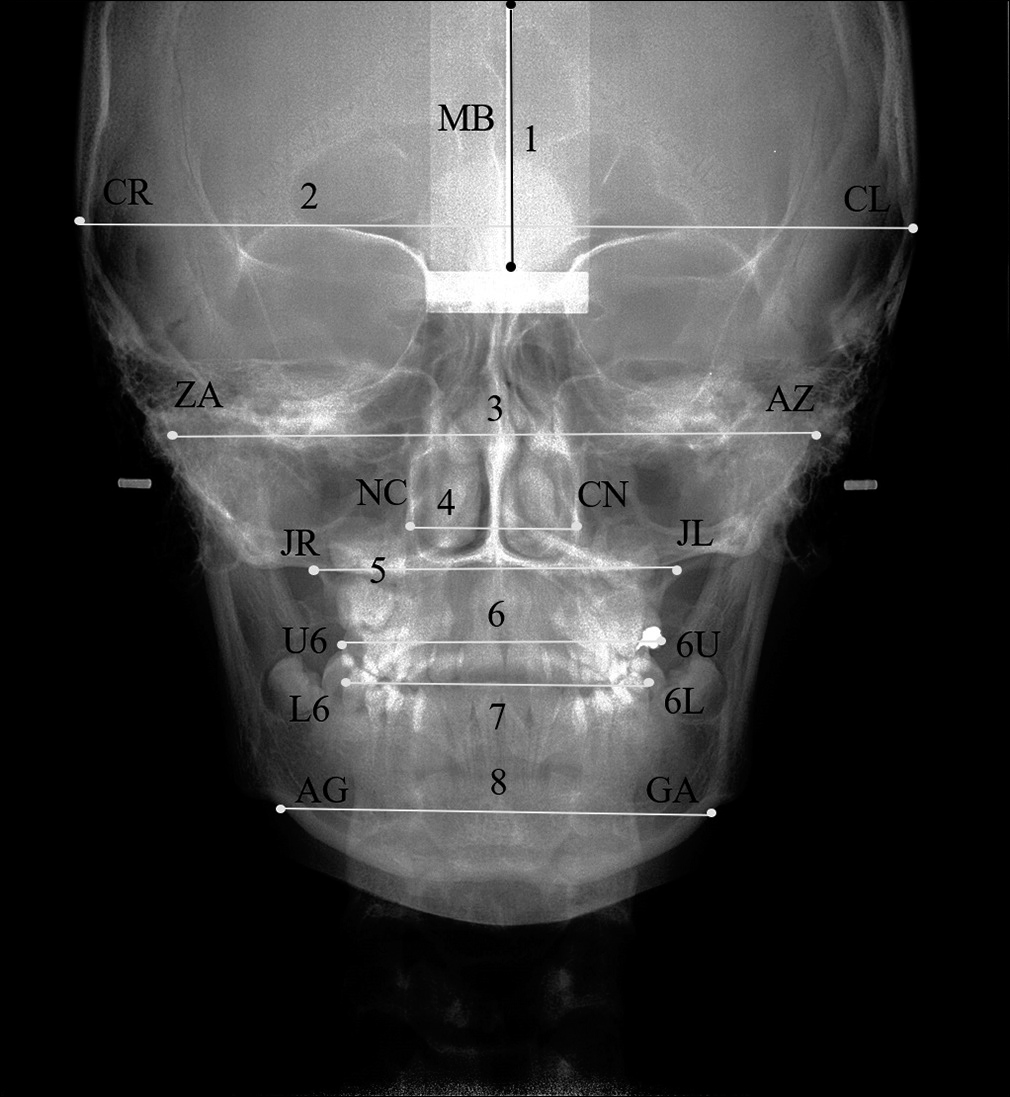
- Anatomic landmarks and transverse measurements.CR, most lateral point on the right cranium, CL, most lateral point on the left cranium, ZA, most lateral point on the right zygomathic arch, AZ, most lateral point on the left zygomathic arch, NC, the most lateral point on the right nasal cavity, CN, the most lateral point on the left nasal cavity, JR, intersection of the outline of the right maxillary tuberosity and right zygomatic buttress, JL, intersection of the outline of the left maxillary tuberosity and left zygomatic buttress, U6, the most lateral point on the buccal surface of the right maxillary first molar, 6U, the most lateral point on the buccal surface of the left maxillary first molar, L6, the most lateral point on the buccal surface of the left mandibular first molar, 6L, the most lateral point on the buccal surface of the left mandibular first molar, AG, lateral and inferior border of the right antegonial notch, GA, lateral and inferior border of the left antegonial notch.1, metal bar, 2, (CR-CL) cranial width, 3, (ZA-AZ) facial width, 4, (NC-CN) nasal width, 5, (JR-JL) maxillary width, 6, (U6-6U) maxillary intermolar width, 7, (L6-6L) mandibular intermolar intermolar, 8, mandibular width (AG-GA).
In our study, hand-wrist radiographs were used to evaluate skeletal maturation. Growth and development periods were evaluated according to Björk,[12] Grave and Brown[13] method. According to this method, subjects are divided into 9 stages of skeletal maturation (SMS).
The hand-wrist radiographs were evaluated by a single experienced observer (FNU). The transverse measurements were carried out by two experienced observers (TSE and FNU). To determine the accuracy and reliability of the posteroanterior cephalograms and hand-wrist radiographs, 50 radiographs were re-evaluated blindly 4 weeks following the measurements by the same observers.
The data were analyzed using the SPSS Statistics software package program (Version 20, IBM Co., Armonk, NY, USA). The average and standard deviations were used in descriptive statistics. Shapiro-Wilk test was used as test of normality.
The linear regression model was used to determine which SMS were effective in explaining transversal measurements. T test was used to evaluate differences between genders. Pearson Correlation Coefficient was used to analyze the relation between transversal measurements. P < 0.05 was considered to represent statistical significance.
RESULTS
Intra/interexaminer correlation coefficient indicated high reliability between two measurements for all transverse measurements (interexaminer r = 0.85 intraexaminer r = 0.88˂˂×˂1.00; ˂1.00). The coefficients of reliability were found to be between 0.89 and 0.99 for the hand-wrist evaluations.
[Table 1] shows the number of individuals and average ages of 572 individuals included in our study at the stages of skeletal maturation by gender.
| SMS | Female | Male | ||
|---|---|---|---|---|
| n | Age (year) | n | Age (year) | |
| 1 | 30 | 8.27±1.17 | 35 | 9.14±1.33 |
| 2 | 30 | 9.40±1.22 | 32 | 10.84±1.63 |
| 3 | 33 | 10.55±1.48 | 30 | 11.17±1.58 |
| 4 | 30 | 10.47±1.31 | 30 | 12.27±0.97 |
| 5 | 33 | 11.42±1.06 | 33 | 13.21±1.24 |
| 6 | 30 | 12.77±1.25 | 30 | 14.37±1.03 |
| 7 | 31 | 13.52±1.55 | 30 | 14.83±1.02 |
| 8 | 37 | 14.35±1.25 | 30 | 15.10±1.24 |
| 9 | 38 | 15.68±1.19 | 30 | 16.50±1.04 |
| Total | 292 | 11.98±2.65 | 280 | 13.00±2.58 |
SMS: Skeletal maturation stage
Transversal measurements of females and males in SMS and statistical differences between the genders are shown in [Table 2]. No statistically significant difference was found between females and males in cranial, facial and nasal width values up to SMS 5. In maxillary, mandibular, maxillary intermolar and mandibular intermolar width measurements, males had greater values in most stages of skeletal maturation compared to females.
| SMS | Cranial width | Facial width | Nasal Width | Maxillary width | Mandibular width | |||||||||||||||
|---|---|---|---|---|---|---|---|---|---|---|---|---|---|---|---|---|---|---|---|---|
| Female | Male | P | Female | Male | P | Female | Male | P | Female | Male | P | Female | Male | P | ||||||
| Mean±SD | Mean±SD | Mean±SD | Mean±SD | Mean±SD | Mean±SD | Mean±SD | Mean±SD | Mean±SD | Mean±SD | |||||||||||
| 1 | 140.62±11.75 | 143.94±10.66 | 0.237 | 112.28±9.56 | 112.69±8.30 | 0.854 | 26.78±2.86 | 27.29±2.60 | 0.455 | 56.25±4.15 | 59.22±4.25 | 0.006 | 71.35±6.34 | 75.31±5.84 | 0.011 | |||||
| 2 | 144.78±7.28 | 145.95±9.06 | 0.581 | 112.99±6.32 | 115.97±7.58 | 0.100 | 27.27±1.79 | 27.51±2.14 | 0.645 | 58.45±2.87 | 59.81±4.39 | 0.159 | 74.37±4.57 | 77.62±5.38 | 0.013 | |||||
| 3 | 144.05±10.68 | 144.09±9.42 | 0.476 | 115.82±10.05 | 116.23±8.03 | 0.858 | 27.79±3.09 | 28.43±2.59 | 0.385 | 58.74±4.12 | 60.89±3.65 | 0.033 | 75.83±5.89 | 76.23±4.82 | 0.774 | |||||
| 4 | 143.46±8.80 | 144.30±10.82 | 0.744 | 115.24±6.52 | 116.53±9.85 | 0.551 | 27.88±2.53 | 28.55±3.72 | 0.415 | 60.16±3.77 | 61.45±4.62 | 0.240 | 77.27±4.79 | 78.57±7.16 | 0.414 | |||||
| 5 | 132.21±8.52 | 146.69±9.45 | <0.001 | 105.94±6.75 | 115.06±7.18 | <0.001 | 25.43±2.63 | 29.27±3.60 | <0.001 | 56.79±3.76 | 62.77±4.13 | <0.001 | 70.95±5.33 | 80.87±7.01 | <0.001 | |||||
| 6 | 142.53±8.58 | 147.09±8.71 | 0.046 | 115.38±8.30 | 122.20±8.99 | 0.003 | 29.55±2.84 | 31.06±2.59 | 0.035 | 60.39±4.06 | 62.47±4.73 | 0.073 | 80.53±6.56 | 84.12±5.59 | 0.026 | |||||
| 7 | 140.47±8.97 | 150.28±18.20 | 0.009 | 114.77±7.79 | 124.47±15.33 | 0.003 | 28.90±2.86 | 30.28±4.67 | 0.168 | 58.52±3.16 | 63.36±7.25 | 0.002 | 77.20±5.16 | 84.29±11.19 | 0.002 | |||||
| 8 | 133.95±7.13 | 145.08±11.63 | <0.001 | 109.57±6.07 | 115.81±7.84 | <0.001 | 27.06±2.51 | 29.67±3.81 | 0.002 | 58.75±4.12 | 63.51±5.33 | <0.001 | 75.00±4.91 | 82.03±6.27 | <0.001 | |||||
| 9 | 133.62±6.88 | 149.61±7.34 | <0.001 | 110.11±6.66 | 123.20±7.38 | <0.001 | 27.60±2.80 | 30.78±2.36 | <0.001 | 58.83±3.50 | 63.89±3.01 | <0.001 | 75.61±4.95 | 84.84±6.30 | <0.001 | |||||
| SMS | Mandibular intermolar width | Maxillary intermolar width | Mx-Mn width difference | Mx-Mn width ratio | ||||||||||||||||
| Female | Male | P | Female | Male | P | Female | Male | P | Female | Male | P | |||||||||
| Mean±SD | Mean±SD | Mean±SD | Mean±SD | Mean±SD | Mean±SD | Mean±SD | Mean±SD | |||||||||||||
| 1 | 52.38±4.60 | 54.66±5.09 | 0.065 | 51.71±4.10 | 53.55±4.56 | 0.094 | 15.10±4.18 | 16.09±3.33 | 0.292 | 79.06±4.58 | 78.74±3.52 | 0.753 | ||||||||
| 2 | 55.04±2.98 | 56.42±5.42 | 0.218 | 54.17±3.68 | 56.07±5.66 | 0.124 | 15.92±4.14 | 17.81±4.12 | 0.077 | 78.77±4.60 | 77.16±4.49 | 0.168 | ||||||||
| 3 | 54.98±4.24 | 57.89±4.03 | 0.007 | 53.60±3.92 | 55.92±4.02 | 0.024 | 17.10±3.90 | 15.34±4.06 | 0.085 | 77.60±4.15 | 80.01±4.53 | 0.031 | ||||||||
| 4 | 56.06±4.04 | 58.54±5.23 | 0.044 | 55.13±2.80 | 56.52±4.89 | 0.181 | 17.12±3.99 | 17.12±4.85 | 1.000 | 77.97±4.38 | 78.47±4.93 | 0.676 | ||||||||
| 5 | 53.25±3.47 | 59.36±7.79 | <0.001 | 51.45±3.94 | 57.77±4.76 | <0.001 | 14.16±3.65 | 18.10±5.24 | 0.001 | 80.20±4.27 | 77.91±5.15 | 0.054 | ||||||||
| 6 | 59.33±4.89 | 61.15±3.65 | 0.107 | 56.37±4.55 | 59.05±4.65 | 0.028 | 20.15±5.47 | 21.65±4.81 | 0.262 | 75.26±5.58 | 74.38±4.89 | 0.517 | ||||||||
| 7 | 57.64±4.46 | 62.01±7.95 | 0.010 | 55.93±3.99 | 60.61±7.76 | 0.004 | 18.68±4.62 | 20.93±6.22 | 0.114 | 76.00±4.85 | 75.44±4.98 | 0.659 | ||||||||
| 8 | 55.20±3.88 | 59.96±5.67 | <0.001 | 54.33±3.90 | 59.87±5.44 | <0.001 | 16.26±3.29 | 18.52±3.39 | 0.007 | 78.39±3.79 | 77.45±3.47 | 0.299 | ||||||||
| 9 | 55.84±4.73 | 61.74±4.24 | <0.001 | 54.55±3.92 | 61.012±4.20 | <0.001 | 16.78±3.37 | 20.95±5.56 | <0.001 | 77.91±3.55 | 75.58±4.93 | 0.034 | ||||||||
SMS: Skeletal maturation stage
The results of the regression model, in which transversal measurements are considered dependent variables, SMS are considered independent variables, are included in [Table 3], and the regression equation is included in [Table 4]. Nasal width increased by 0.44 mm in males between SMS. Maxillary width increased by 0.17 mm in females, 0.60 mm in males, mandibular width by 0.37 mm in females, 1.21 mm in males, maxillary intermolar width by 0.27 mm in females, 0.89 mm in males, mandibular intermolar width by 0.34 mm in females, 0.842 mm in males at each maturation stage.
| Parameter | Gender | Estimate(β) | 95% CI | t | P |
|---|---|---|---|---|---|
| Cranial width | Female | −1.187 | −1.600– −0.773 |
−5.658 | 0.000 |
| Male | 0.584 | 0.090–1.078 | 2.326 | 0.021 | |
| Facial width | Female | −0.386 | −0.744– −0.028 |
−2.122 | 0.035 |
| Male | 1.069 | 0.639–1.499 | 4.896 | 0.000 | |
| Nasal width | Female | 0.094 | −0.032–0.220 | 1.464 | 0.144 |
| Male | 0.448 | 0.302–0.593 | 6.052 | 0.000 | |
| Maxillary width | Female | 0.172 | 0.001–0.343 | 1.975 | 0.049 |
| Male | 0.601 | 0.389–0.812 | 5.598 | 0.000 | |
| Mandibular width | Female | 0.376 | 0.115–0.637 | 2.839 | 0.005 |
| Male | 1.217 | 0.907–1.528 | 7.711 | 0.000 | |
| Mand intermolar width | Female | 0.349 | 0.152–0.546 | 3.490 | 0.001 |
| Male | 0.842 | 0.604–1.080 | 6.964 | 0.000 | |
| Max intermolar width | Female | 0.279 | 0.099–0.459 | 3.048 | 0.003 |
| Male | 0.891 | 0.657–1.125 | 7.503 | 0.000 | |
| Mx-Mn width difference | Female | 0.205 | 0.014–0.395 | 2.117 | 0.035 |
| Male | 0.617 | 0.399–0.835 | 5.563 | 0.000 | |
| Mx-Mn width ratio | Female | −0.172 | −0.372–0.029 | −1.684 | 0.093 |
| Male | −0.411 | −0.624– −0.199 |
−3.809 | 0.000 |
| Parameter | Sex | Predictive equation | R2 | P |
|---|---|---|---|---|
| Cranial width | Female | Y=145.34−1.187X | 0.099 | <0.001 |
| Male | Y=143.43+0.584X | 0.019 | 0.021 | |
| Facial width | Female | Y=114.29–0.386X | 0.015 | 0.035 |
| Male | Y=112.63+1.069X | 0.079 | <0.001 | |
| Nasal width | Female | Y=27.071–0.032X | 0.007 | 0.144 |
| Male | Y=26.962+0.448X | 0.116 | <0.001 | |
| Maxillary width | Female | Y=57.652+0.172X | 0.013 | 0.049 |
| Male | Y=58.927+0.601X | 0.101 | <0.001 | |
| Mandibular width | Female | Y=73.370+0.376X | 0.027 | 0.005 |
| Male | Y=74.349+1.217X | 0.176 | <0.001 | |
| Mand intermolar width | Female | Y=53.700+0.349X | 0.040 | 0.001 |
| Male | Y=54.855+0.842X | 0.149 | <0.001 | |
| Max intermolar width | Female | Y=52.686+0.279X | 0.031 | 0.003 |
| Male | Y=53.359+0.891X | 0.168 | <0.001 | |
| Mx-Mn width difference | Female | Y=15.718+0.205X | 0.015 | 0.035 |
| Male | Y=15.422+0.617X | 0.100 | <0.001 | |
| Mx-Mn width ratio | Female | Y=78.820−0.172X | 0.010 | 0.093 |
| Male | Y=79.291−0.411X | 0.050 | <0.001 |
Cumulative growth percentages were analyzed for transversal measurements. [Table 5] With the completion of 98% of cumulative growth, the nasal value for females and males was found to be SMS 2 and SMS 7, maxillary width SMS 2 and SMS 5, mandibular width SMS 2 and SMS 6, mandibular intermolar width SMS 2 and SMS 6, maxillary intermolar width SMS 2 and SMS 7. It was found that female’s growth was completed much earlier than males.
| SMS | Cranial width | Facial width | Nasal width | Maxillar width | Mandibular width | Mand_intermolar | Max_intermolar | Mx-Mn difference | Mx-Mn ratio | |||||||||
|---|---|---|---|---|---|---|---|---|---|---|---|---|---|---|---|---|---|---|
| Female | Male | Female | Male | Female | Male | Female | Male | Female | Male | Female | Male | Female | Male | Female | Male | Female | Male | |
| Mean | Mean | Mean | Mean | Mean | Mean | Mean | Mean | Mean | Mean | Mean | Mean | Mean | Mean | Mean | Mean | Mean | Mean | |
| 1 | 105,2358 | 96,2104 | 101,9721 | 91,4657 | 97,0262 | 88,6379 | 95,6133 | 92,6909 | 94,3663 | 88,7689 | 93,8118 | 88,5278 | 94,7922 | 87,7606 | 89,9937 | 76,8087 | 101,4774 | 104,1825 |
| 2 | 108,3516 | 97,5537 | 102,6260 | 94,1305 | 98,8258 | 89,3544 | 99,3498 | 93,6130 | 98,3603 | 91,4920 | 98,5742 | 91,3763 | 99,3082 | 91,9011 | 94,8907 | 85,0239 | 101,1063 | 102,0977 |
| 3 | 107,8061 | 96,3148 | 105,1886 | 94,3452 | 100,7123 | 92,3443 | 99,8337 | 95,3042 | 100,2912 | 89,8511 | 98,4695 | 93,7591 | 98,2632 | 91,6416 | 101,8954 | 73,2220 | 99,5990 | 105,8697 |
| 4 | 107,3637 | 96,4529 | 104,6635 | 94,5887 | 101,0120 | 92,7450 | 102,2478 | 96,1860 | 102,1956 | 92,6093 | 100,3890 | 94,8119 | 101,0620 | 92,6359 | 102,0128 | 81,7025 | 100,0696 | 103,8309 |
| 5 | 98,9436 | 98,0531 | 96,2165 | 93,3933 | 92,1366 | 95,0829 | 96,5219 | 98,2516 | 93,8309 | 95,3204 | 95,3599 | 96,1458 | 94,3245 | 94,6786 | 84,3951 | 86,3817 | 102,9307 | 103,0839 |
| 6 | 106,6677 | 98,3200 | 104,7906 | 99,1910 | 107,0754 | 100,9096 | 102,6387 | 97,7799 | 106,5070 | 99,1568 | 106,2450 | 99,0417 | 103,3475 | 96,7714 | 120,0711 | 103,3556 | 96,5919 | 98,4087 |
| 7 | 105,1267 | 100,4523 | 104,2404 | 101,0281 | 104,7084 | 98,3541 | 99,4648 | 99,1756 | 102,1029 | 99,3556 | 103,2222 | 100,4265 | 102,5448 | 99,3335 | 111,3531 | 99,9045 | 97,5444 | 99,8180 |
| 8 | 100,2472 | 96,9743 | 99,5117 | 93,9989 | 98,0411 | 96,3942 | 99,8546 | 99,4156 | 99,1962 | 96,6956 | 98,8500 | 97,1171 | 99,5961 | 98,1262 | 96,8878 | 88,4010 | 100,6138 | 102,4769 |
| 9 | 100,0000 | 100,0000 | 100,0000 | 100,0000 | 100,0000 | 100,0000 | 100,0000 | 100,0000 | 100,0000 | 100,0000 | 100,0000 | 100,0000 | 100,0000 | 100,0000 | 100,0000 | 100,0000 | 100,0000 | 100,0000 |
Correlations between all transversal measurements of males and females were found to be statistically significant (P < 0.001, r = 0.51 ˂×˂0.85).
DISCUSSION
In orthodontic and orthopedic treatments, the timing of treatment planning is critical as well as the treatment protocol. Starting treatment during the appropriate maturation period of the individual is important for the remaining growth of the craniofacial region and can ensure the best response from the treatment.[9,14] Individual variations can be encountered when evaluating growing individuals using chronological age. For this reason, evaluation of transversal measurements according to SMSs can benefit in proper and timely treatment.[9] To the best of our knowledge, the present research was the first to evaluate the changing between the SMSs with regression analyze.
Transversal measurements were evaluated according to chronological age in many populations such as American, Chinese, Kuwaiti, Austrian, Pakistani, Northern Irish, Japanese, Caucasian, and Turkish.[3-7,10,11,15] Uysal and Sari[6] determined posteroanterior cephalometric norms in adult Turkish individuals. Yavuz et al.[7] reported longitudinally transversal measurement results in individuals between 10 and 14 years of age. Besides, measurements were made in individuals living in a single region in these two studies. In contrast to other studies, transversal measurements according to SMSs were made by determining transversal measurements of individuals living in different regions.
Hand-wrist radiography is often used to determine skeletal maturation since bones in the wrist region have different ossification times. In our study, the Björk,[12] Grave and Brown[13] method was used, and the average age at each stage of skeletal maturation was close to those in our study; at each stage, it was observed that there was a 1-year age difference in Turkish individuals.
Nasal width is a value that can be changed by treatments such as rapid maxillary expansion, which provides an orthopedic effect. It can increase in the range of approximately 1.06 to 3.47 mm with rapid maxillary expansion.[16] In addition, there is an increase in studies in which the volume of the nasal cavity is measured using an acoustic rhinometry device.[17,18] Having a sufficient width of the nasal cavity contributes to better nasal breathing.[16] A person’s nasal breathing becomes very important for orthodontists, as it is effective for the growth and development of the entire craniofacial system.[16] Ricketts[19] found that nasal width was 25 mm at age 9 and increased by 0.5 mm/year with growth. Snodell et al.[11]reported that the increase ranged from 24.6 mm in females, 24.7 mm in males, and between 0.2 mm and 1.4 mm/year. In our study, nasal width increased by 0.09 mm in girls and 0.44 mm in males between SMSs. In addition, the studies found that nasal dilatation was higher in males than in females, supporting our study.[5,9,11,20]
Nasal width and maxillary width were correlated with each other in both genders (r = 0.55 in female, r = 0.64 in male). This correlation confirms the positive directional relationship between airway and maxillary width.[21,22]
Ricketts found that maxillary width increased by 0.6 mm/year.[19] In our study, it was found that the increase in each SMS was 0.17 mm in females and 0.60 mm in males. This result supports Ricketts’ study, especially in males.
Savara and Singh[23] found that incremental growth rates decreased from 6 to 13 years of age, but had a peak between 14 and 15 years of age. Similarly, Snodell et al.[11] determined a decrease in the growth rate between the ages of 6 and 14 and acceleration at the age of 15. In our study, it seems that the increase in men was regular, unlike these studies. Although a decrease appears in the fifth stage in women, this may have been caused by individual growth variations, which can be considered a limitation of cross-sectional study.
Hwang et al.,[9] found that 99% of maxillary growth was completed in the third stage of skeletal maturation in females and the seventh stage in males. Males completed their maxillary development about 3 years after females.[9,24] In our study, 99% of maxillary growth was completed in the second stage of skeletal maturation in females and the seventh stage in males. This result appears to be more consistent with studies that determine that maxillary growth was completed in females at an average age of 13–14 years and in males at the age of 18 years.[11,23-25]
Ricketts reported an increase in mandibular width of 1.35 mm each year,[19] Snodell et al.[11] reported an increase in the range of 0.5 mm to 2 mm in females and 1.5 mm to 3.0 mm in males. In our study, it was found that there was a smaller increase between the stages of skeletal maturation in females with an increase of 0.37 mm and in males with an increase of 1.21 mm compared to the studies. A study conducted in Turks reported an increase of about 1.7 mm in females and 2.3 mm in males/year between the ages of 10 and 14 years.[7] The discrepancy between skeletal maturation and chronological age and the fact that the population of our study included individuals from different parts of Turkey may have caused this difference.
By calculating the biantegonial distance, Ricketts showed that the mandibular width he found expanded from 68 mm to 91 mm from the age of 7 to the age of 23.[19] In the Korean population, the initial maturation stage was found to be 80 mm in females, 86 mm in males, the final maturation stage was found to be 91 mm in females and 95 mm in males.[9] Since the antegonial area is closer to the teeth and is not disrupted by muscle connections, it is more convenient to use biantegonial width instead of bigonial width[19] In our study, biantegonial width was 71.35 mm in females at the initial maturation stage, 75.31 mm in males; 75.61 mm in females at the final stage and 84.84 mm in males. In a study that measured bigonial width in Turkish individuals who studied longitudinal development between the ages of 10 and 14, it was reported that it was 92.3 mm in females at the age of 10 and 93.2 mm in males. This difference was caused by the different selection of the anatomical landmark used in the measurement. Although the biantegonial distance was used in another study conducted in adult Turkish individuals, the value found as 98.03 mm is quite different from our study. The fact that our study is multi-centered suggests that it may better reflect the Turkish population. For this reason, choosing individuals from each region of a country to determine the normative values, even though within the same country, can lead to more accurate results.
The relationship between the maxilla and mandible determines the presence or absence of transversal skeletal discrepancy.[4] Cortella et al.,[25] believe that the growth of the maxilla is less than that of the mandible and that a compensatory mechanism is necessary to obtain a normal closing relationship (no crossbite). Harmony between maxillary molar teeth and mandibular molar teeth is very important to obtain normal occlusion.[25]
Cortella et al.,[25] emphasized that enlargement factors can change at different ages and that the mandible will be more affected by the maxilla due to the fact that the mandible width is greater than the maxillary width. They reported that using the maxillomandibular ratio would therefore be a more accurate diagnostic guide.[25] Cortella et al.,[25] found that the maxilla mandibular ratio at age 6 was 78.6%, at age 18 it was 74.9%; Athanasiou and Van der Meij[26] found that at age 6 it was 77.8% and at age 15 it was 74%.[25] Hwang et al.,[9] stated that in the first stage of skeletal maturation, it was 78.83% in females, 77.77% in males, and the final stage-74.06% in females and 77.01% in males. In our study, in the first stage of skeletal maturation, it was 79.06% in females, 78.74% in males; in the final stage, it was 77.91% in females and 75.58% in males.
Sillman[27] found a 1.2 mm increase in mandibular intermolar width; Movers[28] found a 1.6 mm increase in females and 2.6 mm increase in males. In our study, it was found that there was an increase of 0.34 mm in females and 0.84 mm in males at each stage of skeletal maturation. These results do not support the decrease Woods[29] found in females and males, and the decrease Snodell et al.[11] found only in females. This difference may have been caused by ethnic differences between nations.
In maxillary intermolar width, Woods[29] found a 2.5 mm increase in females from 7 years to 15 years, 2.6 mm increase in males; Sillman[27] found a 3 mm increase in females from 7 years to 13 years; Movers[28] found a 3.5 mm increase in females from 7 years to 16 years, a 4.2 mm increase in males; Snodell et al.[11] similarly found a 2.1 mm increase in females from 7 years to 16 years, and a 3.6 mm increase in males. An increase of 0.27 mm in females and 0.89 mm in males between each SMS in our study supports the total amount of growth in these studies.
Maxillomandibular difference can be used to evaluate skeletal transversal discrepancy.[30] Betts[30] accepted individuals aged 15.5 years and older as skeletally mature and reported the need for surgical expansion in cases where the maxillomandibular transverse differential index is higher than 5 mm in these individuals. These results have been reached with norm values that apply to Caucasian individuals. It seems that the measurement values in our study were much more than 5 mm; but given that the Turkish individuals included in the study were skeletal Class I, individuals without crossbite and with ideal closure, it seems that the results of Betts[30] were not compatible with Turkish individuals.
Limitations of our study include that transversal measurements between SMSs do not show regular increases or decreases and that individuals included as a result of cross-sectional study design have individual growth variations. Instead of evaluating radiographs taken at once, longitudinal studies using skeletal maturation are needed.
In our study, the use of two-dimensional posteroanterior radiographs can also cause limitations in determining anatomical landmarks due to the appearance of superimpositions. Although the use of 3-D conical beam computed tomography is considered more advantageous, it has ethical restrictions due to high radiation in routine use.[1]
CONCLUSION
With the results of our transversal norm study determined according to the stages of skeletal maturation, deviating values on the current population can be determined.
Most males and females show a statistical difference in transversal measurement value. Gender differences should be considered in the transversal evaluation of individuals in the clinic.
The millimetric increase between SMSs was found to be significant in most transversal values.
Transversal growth was found to be completed earlier in females than in males in all measurement results.
Author contribution
Türkan Sezen Erhamza, Conceptualization, Methodology, Software, Validation, Formal Analysis, İnvestigation, Resources, Data Curation, Writing-Original Draft, Supervision. Burçin Akan, Validation, İnvestigation, Resources, Review. Saadet Çınarsoy Ciğerim, Investigation, Resources, Data Curation, Review. Yasemin Nur Korkmaz, Investigation, Resources, Data Curation, Review. Fatma Nazik Ünver, Software, Validation, Resources, Data Curation.
Data availability statement
The data supporting the conclusions of this article will be made available by the authors, without undue reservation, to any researcher.
Declaration of patient consent
Institutional Review Board (IRB) permission obtained for the study.
Financial support and sponsorship
Nil.
Conflicts of interest
There are no conflicts of interest.
References
- OrthodonticsE-book: Current Principles and Techniques Netherlands: Elsevier Health Sciences; 2016.
- [Google Scholar]
- Posteroanterior cephalometric norms for an adolescent Kuwaiti population. Eur J Orthod. 2011;34:312-7.
- [CrossRef] [PubMed] [Google Scholar]
- Transverse skeletal and dentoalveolar changes during growth. Am J Orthod Dentofac Orthop. 2006;130:721-31.
- [CrossRef] [PubMed] [Google Scholar]
- Posteroanterior cephalometric analysis of white-American and Chinese adolescents: A cross-sectional study. Cranio. 2018;38:402-11.
- [CrossRef] [PubMed] [Google Scholar]
- Posteroanterior cephalometric norms in Turkish adults. Am J Orthod Dentofac Orthop. 2005;127:324-32.
- [CrossRef] [PubMed] [Google Scholar]
- Longitudinal posteroanterior changes in transverse and vertical craniofacial structures between 10 and 14 years of age. Angle Orthod. 2004;74:624-9.
- [Google Scholar]
- Maturation indicators and the pubertal growth spurt. Am J Orthod Dentofac Orthop. 1982;82:299-309.
- [CrossRef] [Google Scholar]
- Dentofacial transverse development in Koreans according to skeletal maturation: A cross-sectional study. Korean J Orthod. 2018;48:39-47.
- [CrossRef] [PubMed] [Google Scholar]
- Data and patterns of transverse dentofacial structure of 6-to 15-year-old children: A posteroanterior cephalometric study. Am J Orthod Dentofac Orthop. 1992;101:465-71.
- [CrossRef] [Google Scholar]
- A longitudinal cephalometric study of transverse and vertical craniofacial growth. Am J Orthod Dentofac Orthop. 1993;104:471-83.
- [CrossRef] [Google Scholar]
- Timing of interceptive orthodontic measures based on stages of maturation. Trans Eur Orthod Soc. 1972;1:61-74.
- [Google Scholar]
- Skeletal ossification and the adolescent growth spurt. Am J Orthod. 1976;69:611-9.
- [CrossRef] [Google Scholar]
- The cervical vertebral maturation (CVM) method for the assessment of optimal treatment timing in dentofacial orthopedics. Semin Orthod. 2005;11:119-29.
- [CrossRef] [Google Scholar]
- Interaction between otorhinolaryngology and orthodontics: Correlation between the nasopharyngeal airway and the craniofacial complex. GMS Curr Top Otorhinolaryngol Head Neck Surg. 2010;9:68.
- [Google Scholar]
- Evaluation of nasal airway resistance during rapid maxillary expansion using acoustic rhinometry. Eur J Orthod. 2004;26:397-401.
- [CrossRef] [PubMed] [Google Scholar]
- Effect of rapid maxillary expansion on halitosis. Am J Orthod Dentofac Orthop. 2018;154:702-7.
- [CrossRef] [PubMed] [Google Scholar]
- Perspectives in the clinical application of cephalometrics: The first fifty years. Angle Orthod. 1981;51:115-50.
- [Google Scholar]
- Transverse development of the craniofacial skeleton and dentition between 7 and 15 years of age-a longitudinal postero-anterior cephalometric study. Eur J Orthod. 2004;26:31-42.
- [CrossRef] [PubMed] [Google Scholar]
- Relationship between rapid maxillary expansion and nasal cavity size and airway resistance: Short-and long-term effects. Am J Orthod Dentofac Orthop. 2008;134:370-82.
- [CrossRef] [PubMed] [Google Scholar]
- Rapid palatal expansion effects on nasal airway dimensions as measured by acoustic rhinometry: A systematic review. Angle Orthod. 2009;79:1000-7.
- [CrossRef] [PubMed] [Google Scholar]
- Norms of size and annual increments of seven anatomical measures of maxillae in boys from three to sixteen years of age. Angle Orthod. 1968;38:104-20.
- [Google Scholar]
- Longitudinal study of facial skeletal growth completion in 3 dimensions. Am J Orthod Dentofac Orthop. 2007;132:762-8.
- [CrossRef] [PubMed] [Google Scholar]
- Transverse development of the jaws: Norms for the posteroanterior cephalometric analysis. Am J Orthod Dentofac Orthop. 1997;112:519-22.
- [CrossRef] [Google Scholar]
- Posteroanterior (frontal) cephalometry In: Orthodontic Cephalometry. London: Mosby-Wolfe; 1995. p. :141-61.
- [Google Scholar]
- Dimensional changes of the dental arches: Longitudinal study from birth to 25 years. Am J Orthod. 1964;50:824-42.
- [CrossRef] [Google Scholar]
- Standards of Human OcclusaI Development. In: Monograph# 5 Craniofacial Growth Series. Ann Harbor, MI: Center of Human Development, The University of Michigan; 1976.
- [Google Scholar]
- Changes in width dimensions between certain teeth and facial points during human growth. Am J Orthod. 1950;36:676-700.
- [CrossRef] [Google Scholar]
- Surgically assisted maxillary expansion. Atlas Oral Maxillofac Surg Clin North Am. 2016;24:67-77.
- [CrossRef] [PubMed] [Google Scholar]


