Translate this page into:
Skeletal, Dentoalveolar, and Periodontal Changes of Skeletally Matured Patients with Maxillary Deficiency Treated with Microimplant-assisted Rapid Palatal Expansion Appliances: A Pilot Study
Address for correspondence: Dr. Peter Ngan, Department of Orthodontics, West Virginia University Department of Orthodontics, 1073 Health Science Center North, P.O. Box 9480, Morgantown, WV 26506, USA. E-mail: pngan@hsc.wvu.edu
This article was originally published by Wolters Kluwer and was migrated to Scientific Scholar after the change of Publisher.
Abstract
Introduction
Microimplant-assisted rapid palatal expansion (MARPE) has recently been offered to adult patients for correcting maxillary transverse deficiency. However, there is limited information in the literature on the success of this appliance and its skeletal and dental effects on skeletally matured patients. The purpose of this study was to investigate the immediate skeletal, dentoalveolar, and periodontal response to MARPE appliance using cone-beam computed tomography in a skeletally matured patient as assessed by the cervical vertebral maturation method.
Materials and Methods
Eight consecutively treated patients (2 females, 6 males; mean age of 21.9 ± 1.5 years) treated with a maxillary skeletal expander were included in the study. Measurements were taken before and after expansion to determine the amount of midpalatal suture opening, upper facial bony expansion, alveolar bone bending, dental tipping, and buccal bone thickness (BBT). Data were analyzed using a one-way ANOVA and matched-pair t-test (α = 0.05).
Results
Midpalatal suture separation was found in 100% of the patients with no dislodged microimplants. Total maxillary expansion was attributed to 41% skeletal, 12% alveolar bone bending, and 48% dental tipping. Pattern of midpalatal suture opening was found to be parallel in both the coronal and axial planes. On average, the absolute dental tipping ranged from 4.17° to 4.96° and the BBT was reduced by an average of 39% measured at the premolars and molars.
Conclusions
The MARPE appliance can be a clinically acceptable, nonsurgical treatment option for correcting mild to moderate maxillary transverse discrepancies for skeletally matured adult patients with a healthy periodontium.
Keywords
Cone-beam computed tomography
microimplant-assisted rapid palatal expansion
microimplants
rapid palatal expansion
skeletally matured
Introduction
Maxillary transverse deficiency (MTD) is commonly found in patients seeking orthodontic care. Reportedly, 9.4% of the whole population and nearly 30% of adult orthodontic patients have MTD related to a posterior crossbite.[1] Conventional rapid palatal expansion (RPE) have proven to be a reliable treatment method for correcting transverse skeletal jaw disharmony in prepubertal patients.[2] However, its use in adult patients has little to no skeletal effects but rather greater dental side effects that may be detrimental to periodontal support.[2-6] Surgical-assisted RPE (SARPE) has been the treatment of choice for maxillary skeletal expansion in adults to overcome the interdigitated maxillary sutures that are resistant to expansion.[5,6] However, the morbidity, risks, and costs related to surgical treatment may discourage many adult patients.[7,8] Recently, much attention has been given to the use of microimplant-assisted RPE (MARPE) and its use as a nonsurgical treatment option for correcting MTD in adult patients.[7,8] However, limited information is available in the literature on the skeletal and dental effects of this appliance. Several methods have been proposed to measure the maturation of maxillary sutures.[9,10] Jang et al. found correlations of maxillary suture maturation with cervical vertebral maturation (CVM) method and hand-wrist method (suture maturation index [SMI]).[9] The authors concluded that orthopedic maxillary expansion may be recommended in patients before stage 6 in the SMI and stage 3 in the CVM method. In young patients, the skeletal effects of maxillary expansion were greater at the prepubertal stages, while pubertal or postpubertal stages demonstrated greater dentoalveolar effects.[10] The purpose of this study was to investigate the immediate skeletal, dentoalveolar, and periodontal treatment effects associated with the MARPE appliance in skeletally matured or older patients, as assessed by the CVM method, using cone-beam computed tomography (CBCT) imaging. The null hypotheses were as follows:
There is no midpalatal suture opening in skeletally matured patients treated with MARPE appliance
There are no significant differences in the midpalatal suture opening in the axial plane at the canine (C), first premolar (P1), second premolar (P2), and first molar (M1)
There is no significant difference in midpalatal suture opening in the coronal plane at nasal and palatal floor
There is no significant change in the transverse width of the facial skeleton at the level of the zygomatic bones
There are no significant differences in expansion at the zygomatic bones compared to the infrazygomatic crests
There is no significant difference in the palatal alveolar angle (PAA) between T1 and T2 measured at P1 and M1
There is no significant difference in the dental tipping angle (DTA) between T1 and T2 measured at P1 and M1
There is no significant difference in the buccal bone thickness (BBT) between T1 and T2 measured at the first premolar (P1), mesiobuccal root of the first molar (MB-M1), and distobuccal root of first the molar (DB-M1).
Materials and Methods
Sample description and collection
This study has been approved by the Institutional Review Board of West Virginia University (Ref #: 1501557557) for a retrospective, nonrandomized pilot investigation. Fifteen patients from the archives of West Virginia University Orthodontic Department between 2015 and 2017 who were consecutively treated with a maxillary skeletal expander (MSE) were selected. The inclusion criteria consisted of patients who have a full-field CBCT scans of diagnostic quality, including all pertinent anatomy, captured before and immediately after maxillary expansion; patients with a CVM stage of 4 or greater based on the method published by Baccetti et al.;[10] patients with no history of previous orthodontic or orthopedic treatment, or no craniofacial syndrome or deformities. Patients with incomplete records, periodontal problems, and craniofacial anomalies were excluded from the study.
Pretreatment (T1) and an immediate postexpansion (T2) CBCT scans were collected for each patient. The scanned tomographic images were de-identified and coded with numbers to protect patient privacy. All CBCT scan images were obtained with the Kodak Carestream 9300 (Carestream Health, Inc., Rochester, NY, USA) cone-beam three-dimensional (3D) imaging scanner. The chosen field of view was 17 cm × 13 cm with a 0.3-mm voxel size and 16-bit grayscale. Exposure components were preadjusted to the selected field of view: 11.30 s scan time, 85 KV, and 4.0 mA. All patients were scanned in the supine position, upright head posture, and maximum intercuspation. DICOM files were assessed using the Invivo 5 Advanced 3D imaging software (Anatomage, San Jose, CA, USA).
Patients presenting with CVM 4 or greater were categorized as skeletally matured. Two investigators (P.N. and K.U.N.) were employed to judge the skeletal maturation. The judges were calibrated and patients were included in the study if both judges agreed on the same stage of CVM. Seven patients were excluded from the original sample due to inadequate tomograms or lack of skeletal maturity. The remaining eight patients (2 females, 6 males) were included in the final sample with a mean age of 21.9 years.
Appliance description
The MSE is a specific type of MARPE appliance manufactured by BioMaterials Korea, Inc. [Figure 1]. The appliance consists of a central expansion screw and four attached arms that may be soldered to prefitted orthodontic bands on the anchor teeth to facilitate placement of the appliance. Welded to the central expansion screw are four tubes that serve as guides for microimplant placement. The microimplants allow fixation of the expander flushed to the palate and are 1.8 mm in diameter and 11 mm in length. The microimplant length permitted bicortical engagement of the palatal and nasal floor, while the diameter of the microimplants provided a secure fit within the tubes, reducing the magnitude of lateral force transfer to anchor teeth during appliance activation.
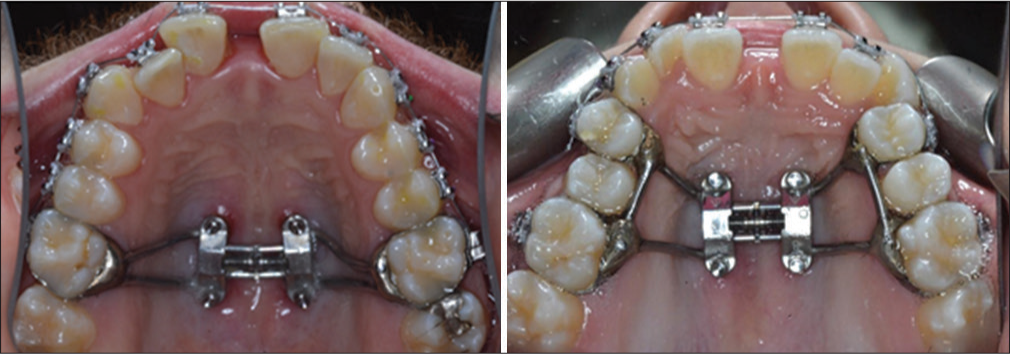
- Maxillary Skeletal Expander (MSE) fabrication
Although the same expander was used for all patients in the study sample, there were variations relating to the following:
Number of teeth selected for appliance anchorage. The expander was either banded to first premolars and first molars or first molars only [Figure 1]
-
Appliance placement along the palate. The expansion appliance was placed in one of three locations along the palate:
On the inclines of the anterior palate distal to the second or third rugae (anterior position)
On the flat surface of the palate around the level of the permanent second premolar (middle position)
On the flat surface of the palate 1 mm anterior to the soft palate near the level of the permanent first molar (posterior position).
Appliance activation varied with the severity of transverse discrepancy between the upper and lower jaws. The termination point was clinical observation of 2–3 mm of overexpansion determined by the clinician and the faculty. According to Sari et al.,[11] expansion was considered adequate when the occlusal aspect of the lingual cusp of the maxillary first molars contacted the occlusal aspect of the facial cusp of the mandibular first molars. The 2–3 mm of overexpansion was designed to compensate for relapse
Number of microimplants used to secure appliance to the palate. Two or four microimplants were selected to fixate the expander to the palate.
Cast analysis
Cast analysis was done by measuring the cusp tip-fossa relationship to quantify the maxillary transverse discrepancy for each patient at the canine, first premolar, and first molar area as described in Table 1 and shown in Figure 2. All measurements were adjusted for the uprighting of mandibular posterior teeth.
| Area of maxillary transverse discrepancy assessment | Equation for maxillary transverse discrepancy calculation |
|---|---|
| Canine | Width between distofacial surfaces of mandibular canines - width between mesiolingual surfaces of maxillary canines |
| First premolar | Width between central fossae of mandibular first premolars - width between palatal cusp tip of maxillary first premolars |
| First molar | Width between central fossae of mandibular first molars - width between palatal cusp tip of maxillary first molars |
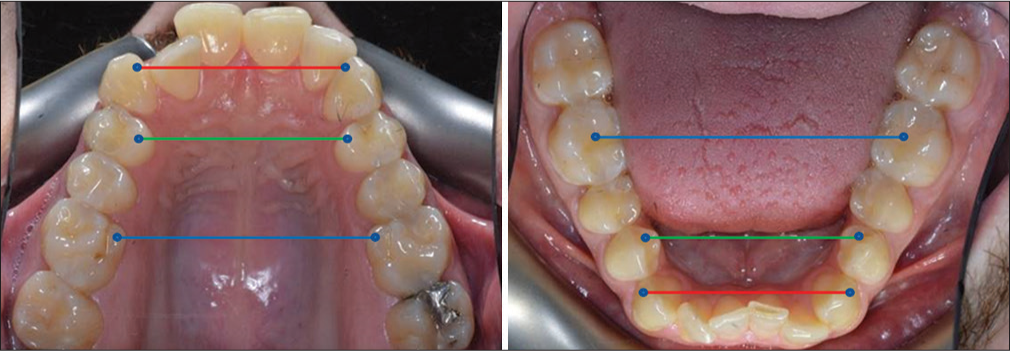
- Landmark illustration for maxillary transverse discrepancy assessment
Cone-beam computed tomography image analysis
Measurement error analysis
The same examiner took all measurements for the tested variables twice at least 2 weeks apart. Matched-paired t-tests were used to assess intraexaminer reliability. The respective measurements were averaged to adjust for measurement error and used for further statistical analysis.
Cone-beam computed tomography image volume reorientation
For the purpose of standardizing the image analysis and setting an identical reference plane for the T1 and T2 scans, all CBCT volumes were oriented in three planes of space (coronal, sagittal, and axial). The image volume orientation was adopted from Molen[12] and performed within the render volume section of the Invivo 5 imaging software [Figure 3].
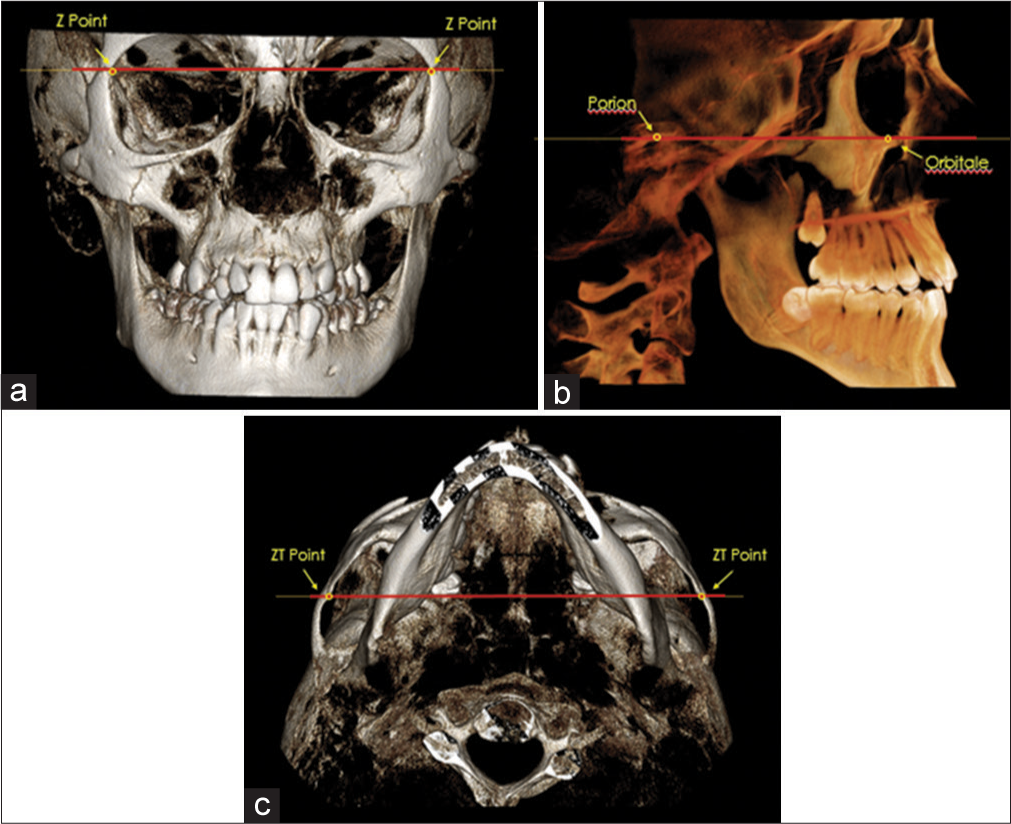
- CBCT orientation on the a) coronal plane; b) sagittal plane; and c) axial plane
The coronal view (frontal perspective) of the 3D image volume was oriented to parallel a line that connected the left and right medial termini of the zygomaticofrontal (ZF) sutures to horizontal. The ZF line served as a stable reference because its location is in the superior third of the craniofacial complex and is adequately distant from the sources of most facial asymmetries.[13]
The sagittal view (right lateral perspective) of the 3D image volume was oriented to parallel a line that connected right porion (Po), the superior point of the external auditory meatus, and orbitale (Or), the inferior margin of the orbit to horizontal. These same landmarks were used to establish the Frankfort plane as described by the World Congress on Anthropology in Frankfurt am Main, Germany, in 1884.[14] A study by Daboul et al. revealed excellent intraexaminer reproducibility and interexaminer reliability of Frankfort horizontal (FH) plane through 3D landmark identification in magnetic resonance images and have suggested that the FH plane is a sufficiently stable landmark-based reference plane for craniofacial structures and treatment analysis.[15]
The axial view (inferior perspective) of the 3D image volume was oriented to parallel a line that connected the left and right medial termini of the zygomaticotemporal (ZT) sutures to horizontal. As described by Molen,[12] the ZT line facilitated the orientation of the volume’s yaw position.
Midpalatal suture maturation assessment
Individual midpalatal suture maturation was evaluated using a novel classification method proposed by Angelieri et al.[16] The visual analysis system is the first to evaluate overall midpalatal suture morphology using CBCT and involves radiographic interpretation of all axial cross-sections of the palate for adequate staging. Five maturational stages (A–E) were developed to describe the degree of midpalatal suture fusion [Table 2]. Patients in stages D and E were considered to have partially or completely fused midpalatal sutures.
| Maturational stages of midpalatal suture | Definition of midpalatal suture maturational stage |
|---|---|
| A | Straight high-density sutural line with no or little interdigitation |
| B | Scalloped appearance of the high-density sutural line |
| C | Two parallel, scalloped high-density lines that were close to each other, separated in some areas by small low-density spaces |
| D | Fusion completed in the palatine bone, with no evidence of a suture |
| E | Fusion anteriorly in the maxilla |
Total expansion
The total expansion (TE) achieved with the MSE appliance included the direct separation of the maxillary halves at the midpalatal suture (skeletal expansion) along with alveolar bone bending and dental tipping (dentoalveolar expansion). The following equation shows the components of

In this study, TE was defined as the change (T2 − T1) in the intermolar width (IMW), the distance between the palatal cusp tip of the right and left first molars (M1) measured in a coronal cross-sectional slice through the center of M1 [Figure 4]. The sutural expansion in the middle of the palate (SEM) and the palatal maxillary width (PMW) measured at M1 furcation were quantified on the same coronal cross-sectional slice [Figure 4]. Alveolar bone bending was defined as any additional palatal alveolar expansion beyond that of sutural separation and determined by subtracting SEM from the change (T2 − T1) in PMW. Dental tipping was computed by subtracting SEM and the calculated alveolar bone bending from TE.
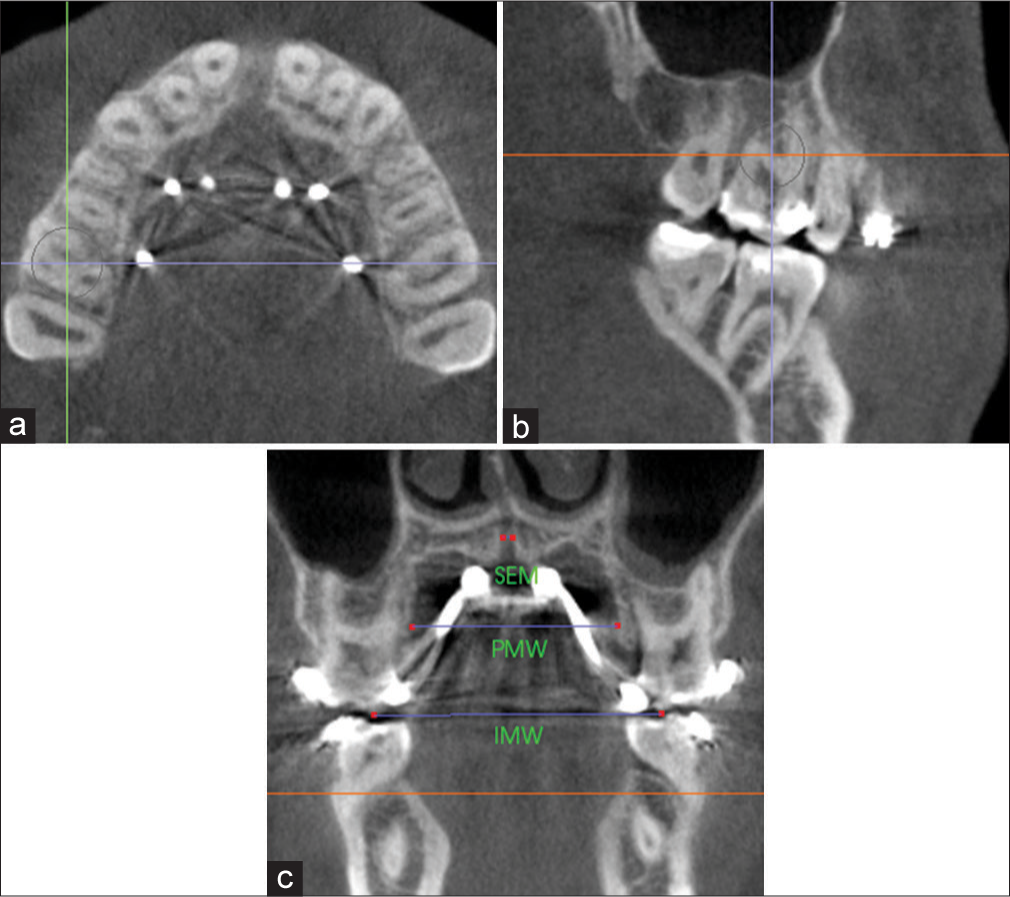
- Measurement of sutural expansion (SEM), palatal maxillary width (PMW) and intermolar width (IMW) on a coronal cross-sectional slice through the midportion of M1. Orientation of landmarks on the a) axial plane; b) sagittal plane; and c) coronal plane
Midpalatal suture expansion pattern
Axial view
Successful midpalatal suture separation was defined as complete opening of the suture anteroposteriorly. Measurements were made at the canine (C), first premolar (P1), second premolar (P2), and first molar (M1) position. The landmarks were identified and recorded with a small dot on an axial cross-sectional slice through the furcation of M1 [Figure 5]. Suture width opening was measured between the right and left external edges of the suture on an axial cross-sectional slice through the center of the palate using the Invivo5 distance measuring tool [Figure 6a-c]. The suture external edges were verified in the coronal cross-sectional slice for each tested position [Figure 6d]. A one-way ANOVA-Tukey’s honest significance difference (HSD) test was used to compare the mean values of midpalatal suture expansion among C, P1, P2, and M1.
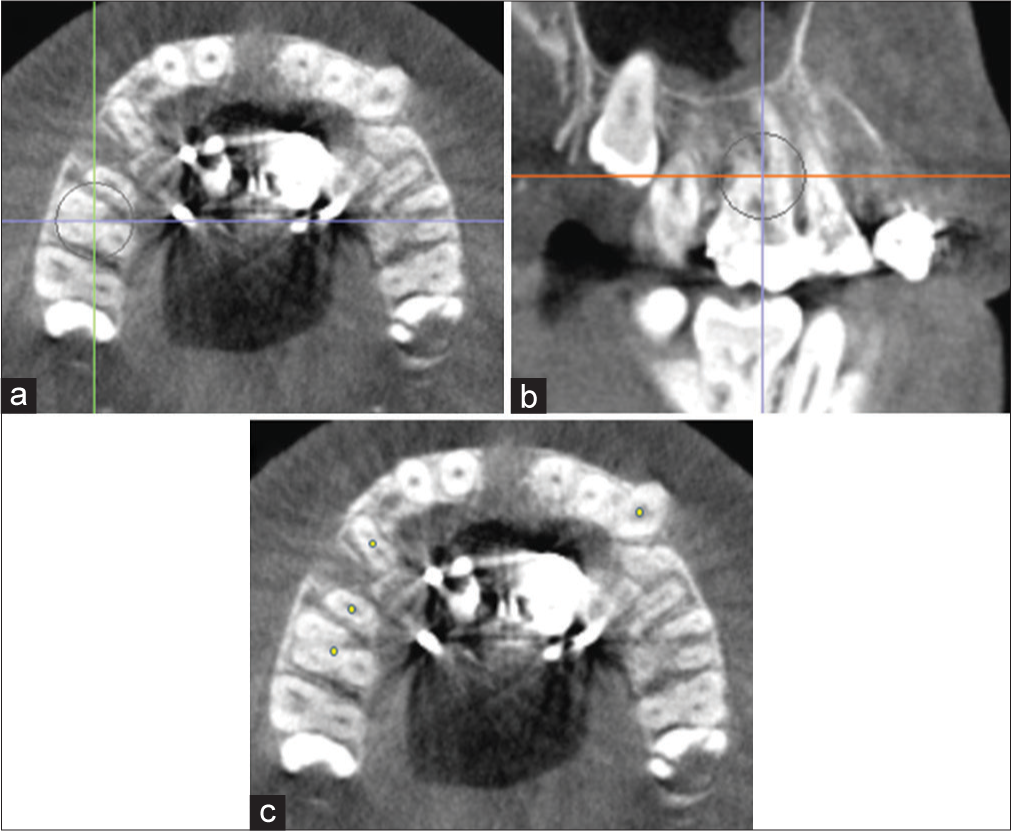
- Identification of canine (C), first premolar (P1), second premolar (P2) and first molar (M1) on an axial cross-sectional slice through M1 Furcation. Orientation of landmarks on the a) axial plane; b) sagittal plane; and c) axial plane

- Measurement of sutural expansion at C, P1, P2 and M1 on an axial cross-sectional slice through the midpalate. Orientation of landmarks on the a) coronal plane; b) sagittal plane; c) axial plane; and d) coronal plane
Coronal view
Midpalatal suture expansion in the coronal view was measured at the nasal and palatal floor on a coronal cross-sectional slice through the center of M1 by connecting the right and left external edges of the suture [Figure 7a]. The suture external edges were verified in the axial cross-sectional slice for each tested position [Figure 7b]. A matched-paired t-test was used to compare the suture opening at the nasal and palatal floor.
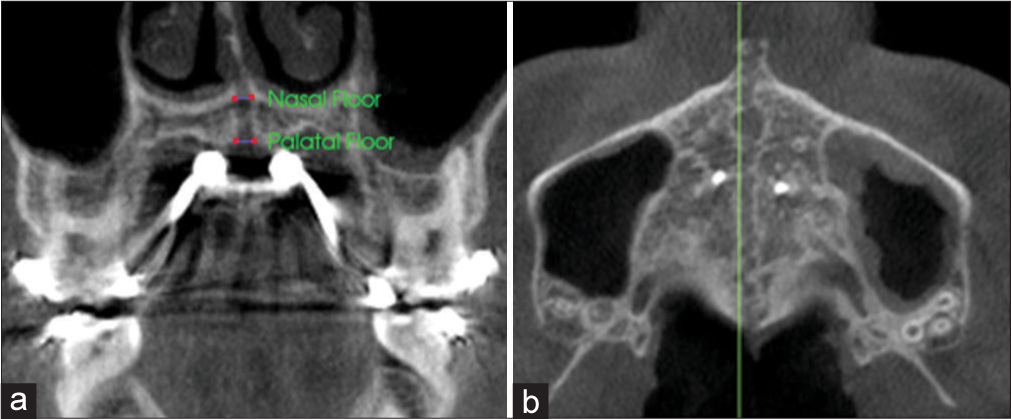
- Measurement of sutural expansion at the nasal and palatal floor on a coronal cross-sectional slice through the midportion of M1. Orientation of landmarks on the a) coronal plane; and b) axial plane.
Angular alveolar bone bending
Angular alveolar bone bending was defined as the degree difference (T2 − T1) between the PAA measured for the anchored teeth, P1, M1, or both, on a coronal cross-sectional slice through the midportion of the teeth. Figure 8 shows the PAA value obtained for M1 by measuring the intersecting angle formed by a best-fit line through the palatal cortical plate and the software’s horizontal indicator line that traverses the middle of the palate. A positive change in PAA indicated alveolar bone bending in the buccal direction. A matched-paired t-test was used to compare T1 and T2 PAA values for each tested variable.
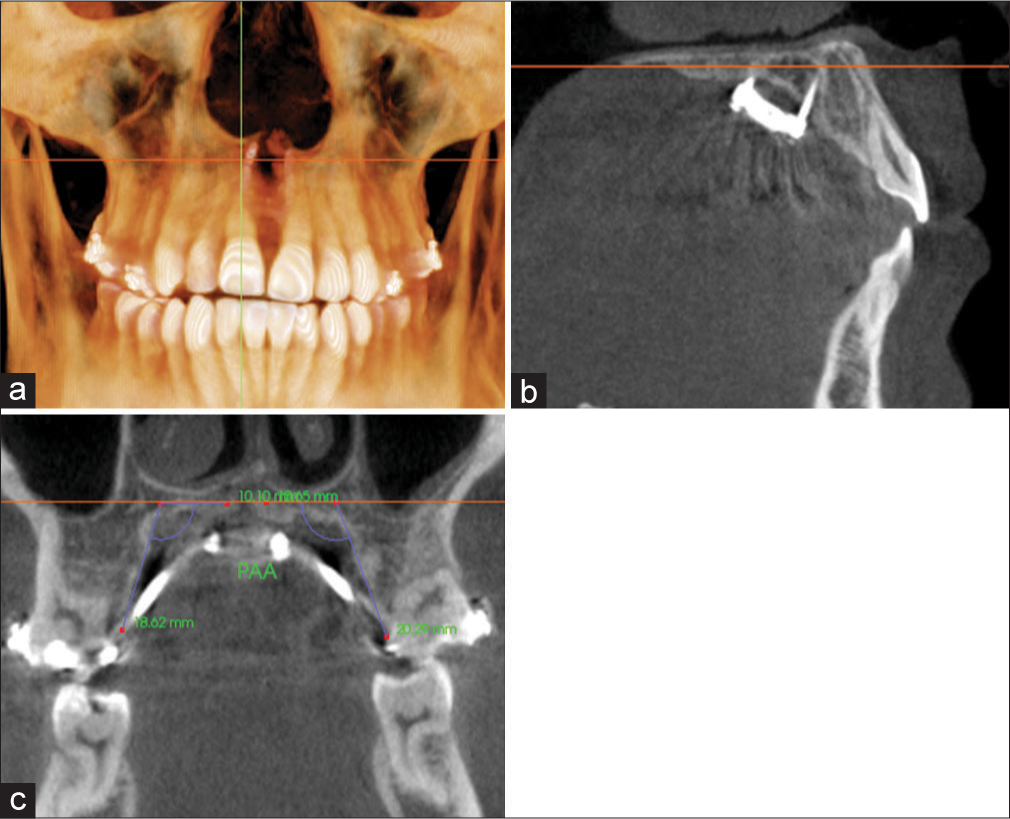
- Measurement of palatal alveolar angle (PAA) for M1 on a coronal cross-sectional slice through the midportion of the tooth. Orientation at the a) coronal plane; b: sagittal plane; and c) coronal plane
Angular dental tipping
Angular dental tipping was defined as the degree difference (T2 − T1) between the DTA measured for the anchored teeth, P1, M1, or both, on a coronal cross-sectional slice through the midportion of the teeth. Figure 9 shows the DTA value obtained for M1 by measuring the intersecting angle formed by a best-fit line through the long axis of the tooth and the software’s horizontal indicator line that transverse the middle of the palate. A positive change in DTA indicated dental tipping in the buccal direction. A matched-paired t-test was used to compare T1 and T2 DTA values for each tested variable.
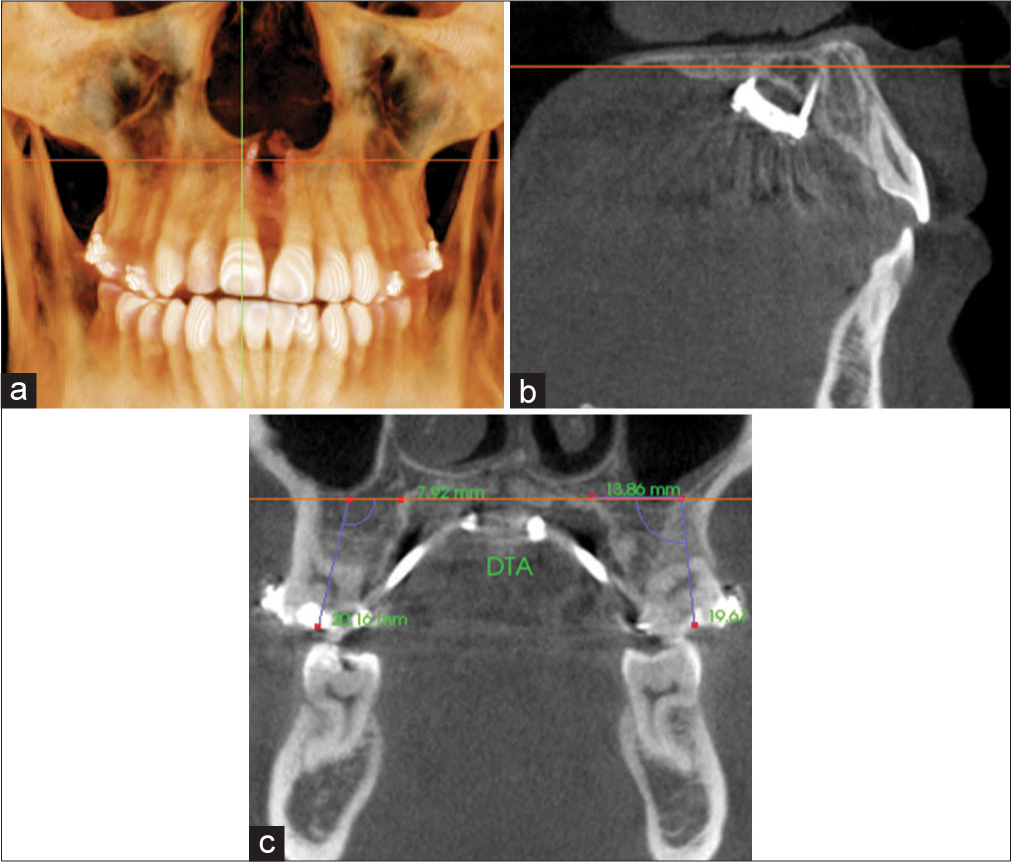
- Measurement of dental tipping angle (DTA) for M1 on a coronal cross-sectional slice through the midportion of the tooth. Orientation at the a) coronal plane; b) sagittal plane; and c) coronal plane
Buccal bone thickness analysis
Buccal bone thickness (BBT) was measured for P1, the mesiobuccal root of M1, and the distobuccal root of M1, when P1, M1, or both was used for appliance anchorage on an axial cross-sectional slice through the furcation of M1 [Figure 10]. BBT was defined as the perpendicular distance between the most facial surface of the tested tooth and the external aspect of the maxillary buccal cortical plate. A matched-paired t-test was used to compare T1 and T2 BBT values for each tested variable.
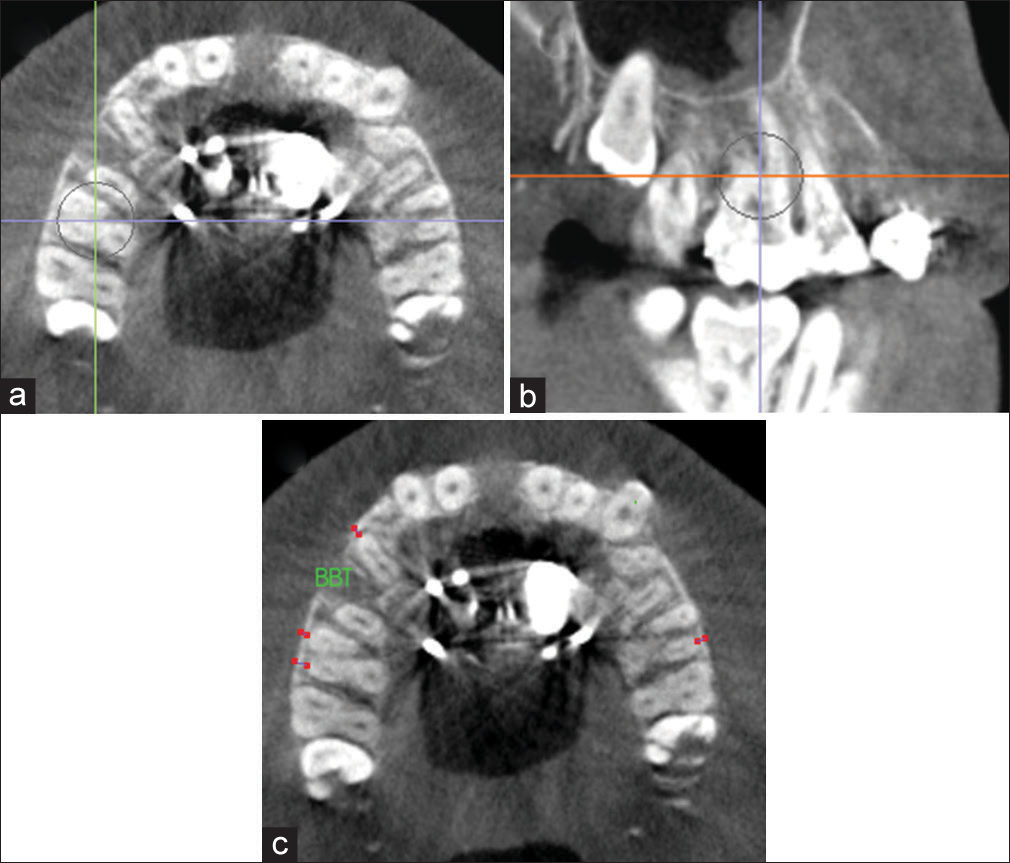
- Measurement of buccal bone thickness (BTT) for P1 and mesiobuccal and distobuccal root of M1 on an axial cross-sectional slice through the furcation of M1. Orientation at the a) axial plane; b) sagittal plane; and c) axial plane
Craniofacial expansion assessment
Individual facial skeletal changes due to expansion treatment were evaluated at the zygomatic and infrazygomatic areas from superimposed 3D models of the skull of T1 and T2 by one expert examiner (T.N.) using protocols developed by Nguyen et al. [Figure 11].[17] Pretreatment and immediate postexpansion CBCT images were registered using the anterior cranial fossa as reference, an area that has been shown to complete growth at 7 years of age using ITK-SNAP 3.6 (open source software).[16] After the registration procedure, ITK-SNAP was used to construct 3D surface models of the anatomic structures of interest and to create 3D color maps for measurements. The registered models were evaluated for the greatest surface displacement/ expansion at the zygomatic bone and infrazygomatic crest areas using Slicer CMF 3.1 (slicer.org). A matched-paired t-test was used to compare the expansion changes (T2 − T1) of the zygomatic and infrazygomatic area on the same side.

- 3D skeletal color maps of superimpositions of T2 over T1 registered at the anterior cranial base with a scale of -4 to +4 mm. Red represents outward displacement of T2 relative to T1. Blue represents inward displacement
Results
Sample analysis
The final sample consisted of eight patients (2 females, 6 males) with a mean age of 21.9 ± 9.73 years. All patients had a CVM of at least 4 and were considered skeletally matured. Individual midpalatal suture assessment showed that two patients were in stage C, three patients were in stage D, and three patients were in stage E. No differentiation was made for medical history or ethnicity. The average appliance activation was 5.61 ± 1.19 mm with a mean treatment time of 7.6 ± 5.7 weeks. The appliance was placed in the anterior palate (palatal inclines distal to the second or third rugae) in four patients and in the middle of the palate (flat surface around the level of the second premolar) in four patients. None of the patients had the expander posteriorly positioned. The number of teeth used for appliance anchorage ranged from 2 to 4 (mean: 3.63). The appliances were secured to the palate with 4-μ implants, except one patient with 2-μ implants.
Intrarater reliability analysis
Matched-paired t-test was used to evaluate the intrarater reliability of the measurements for the tested variables [Tables 3 and 4]. No significant differences were found for all the variables tested except for the T2 measurement of the right PAA at the first molar, indicating high level of accuracy in recording these landmarks and measurements.
| Variable | Mean 1 | Mean 2 | Mean different | P | Significance | |
|---|---|---|---|---|---|---|
| IMW (mm) | M1 | 42.59 | 42.65 | 0.06 | 0.72 | NS |
| PMW (mm) | M1 | 31.67 | 31.64 | −0.03 | 0.87 | NS |
| Buccal bone thickness (mm) | Right | |||||
| P1 | 1.03 | 1.06 | 0.03 | 0.78 | NS | |
| MB-M1 | 1.12 | 1.16 | 0.04 | 0.60 | NS | |
| DB-M1 | 1.90 | 1.86 | −0.04 | 0.75 | NS | |
| Left | ||||||
| P1 | 1.30 | 1.28 | −0.02 | 0.89 | NS | |
| MB-M1 | 1.06 | 1.05 | −0.01 | 0.98 | NS | |
| DB-M1 | 2.12 | 1.88 | −0.24 | 0.05 | NS | |
| Palatal alveolar angle (°) | Right | |||||
| P1 | 113.27 | 108.97 | −4.30 | 0.35 | NS | |
| M1 | 105.01 | 103.89 | −1.13 | 0.36 | NS | |
| Left | ||||||
| P1 | 112.37 | 110.26 | −2.11 | 0.36 | NS | |
| M1 | 105.09 | 105.23 | 0.14 | 0.34 | NS | |
| Dental tipping angle (°) | Right | |||||
| P1 | 87.51 | 87.59 | 0.08 | 0.96 | NS | |
| M1 | 95.64 | 94.00 | −1.64 | 0.12 | NS | |
| Left | ||||||
| P1 | 88.96 | 91.46 | 2.50 | 0.20 | NS | |
| M1 | 98.81 | 97.61 | −1.20 | 0.20 | NS | |
P1 – First premolar; M1 – First molar; MB-M1 – Mesial buccal root of first molar; DB-M1 – Distal buccal root of first molar; NS – Not significant; IMW – Inter-molar width; PMW – Palatal maxillary width
| Variable | Mean 1 | Mean 2 | Mean Different | P | Significance | |
|---|---|---|---|---|---|---|
| IMW (mm) | M1 | 48.83 | 48.92 | 0.09 | 0.62 | NS |
| PMW (mm) | M1 | 34.83 | 35.04 | 0.21 | 0.13 | NS |
| Midpalatal suture expansion in coronal view (mm) | Nasal | 2.45 | 2.61 | 0.15 | 0.11 | NS |
| Middle | 2.49 | 2.61 | 0.12 | 0.42 | NS | |
| Palatal | 2.82 | 3.01 | 0.19 | 0.19 | NS | |
| Midpalatal suture expansion in axial view (mm) | C | 3.69 | 3.37 | −0.31 | 0.19 | NS |
| P1 | 3.71 | 3.76 | 0.05 | 0.78 | NS | |
| P2 | 3.56 | 3.62 | 0.06 | 0.84 | NS | |
| M1 | 3.28 | 3.26 | −0.02 | 0.93 | NS | |
| Buccal bone thickness (mm) | Right | |||||
| P1 | 0.50 | 0.52 | 0.02 | 0.87 | NS | |
| MB-M1 | 0.48 | 0.61 | 0.12 | 0.23 | NS | |
| DB-M1 | 1.35 | 1.43 | 0.08 | 0.34 | NS | |
| Left | ||||||
| P1 | 0.67 | 0.55 | −0.12 | 0.45 | NS | |
| MB-M1 | 0.77 | 0.57 | −0.20 | 0.27 | NS | |
| DB-M1 | 1.70 | 1.76 | 0.06 | 0.58 | NS | |
| Palatal alveolar angle (°) | Right | |||||
| P1 | 119.53 | 119.29 | −0.24 | 0.95 | NS | |
| M1 | 108.84 | 106.17 | −2.67 | 0.015 | * | |
| Left | ||||||
| P1 | 110.71 | 106.50 | −4.21 | 0.32 | NS | |
| M1 | 107.74 | 105.49 | −2.25 | 0.34 | NS | |
| Dental tipping angle (°) | Right | |||||
| P1 | 90.54 | 89.67 | −0.87 | 0.75 | NS | |
| M1 | 102.77 | 102.90 | 0.13 | 0.93 | NS | |
| Left | ||||||
| P1 | 99.17 | 99.59 | 0.41 | 0.90 | NS | |
| M1 | 102.15 | 105.54 | 3.39 | 0.32 | NS | |
*P<0.05. C – Canine; P1 – First premolar; P2 – Second premolar; M1 – First molar; MB-M1 – Mesial buccal root of first molar; DB-M1 – Distal buccal root of first molar; NS – Not significant; IMW – Intermolar width; PMW – Palatal maxillary width
Total expansion
TE achieved from MARPE treatment was 6.26 ± 1.31 mm, defined as the change in the IMW of M1. The amount of skeletal expansion that accounted for TE was 41%, which was determined by using the mean midpalatal suture expansion (2.55 ± 0.71 mm) measured in the middle of the palate at M1 [Table 5]. This meant the remaining 59% that contributed to TE was from dentoalveolar expansion.
| Sites | Time Periods | n | Mean±SD | Maximum | Minimum |
|---|---|---|---|---|---|
| IMW | T1 | 7 | 42.62±0.59 | 45.71 | 38.91 |
| T2 | 7 | 48.88±2.78 | 52.20 | 44.15 | |
| T2-T1 | 7 | 6.26±1.31 | 8.75 | 4.60 | |
| Midpalatal suture expansion at the middle of the palate | T1 | 7 | 0 | 0 | 0 |
| T2 | 7 | 2.55±0.71 | 4.06 | 2.03 | |
| T2-T1 | 77 | 2.55±0.71 | 4.06 | 2.03 | |
| PMW | T1 | 7 | 31.66±2.36 | 34.94 | 27.74 |
| T2 | 7 | 34.94±2.15 | 37.77 | 31.77 | |
| T2-T1 | 7 | 3.28±0.75 | 4.66 | 2.23 |
IMW – Intermolar width; PMW – Palatal maxillary width; SD – Standard deviation
Alveolar bone bending, calculated by subtracting the mean midpalatal suture separation (2.55 ± 0.71 mm) measured in the middle of the palate from the change in PMW (3.28 ± 0.75 mm), was 0.73 ± 0.04 mm. This indicated that alveolar bone bending accounted for 12% of TE. The remaining fraction of TE at the first molar derived from dental tipping was 47% (2.98 ± 0.56 mm).
Midpalatal suture expansion
Axial view
The midpalatal suture was successfully opened in all patients. Mean midpalatal suture expansion (mm) at C, P1, P2, and M1 ranged from 2.71 to 4.70, 2.52 to 4.77, 2.79 to 4.55, and 2.56 to 4.05 mm, respectively [Table 6]. One-way ANOVA combined with a Tukey’s HSD test showed no significant differences among any two tested variables (P > 0.05). This indicated parallel expansion along the length of the midpalatal suture.
| Position | Time Periods | n | Mean±SD | Maximum | Minimum |
|---|---|---|---|---|---|
| C | T1 | 8 | 0 | 0 | 0 |
| T2 | 8 | 3.53±0.80 | 4.70 | 2.71 | |
| T2-T1 | 8 | 3.53±0.80 | 4.70 | 2.71 | |
| P1 | T1 | 8 | 0 | 0 | 0 |
| T2 | 8 | 3.74±0.63 | 4.77 | 2.52 | |
| T2-T1 | 8 | 3.74±0.63 | 4.77 | 2.52 | |
| P2 | T1 | 8 | 0 | 0 | 0 |
| T2 | 8 | 3.59±0.67 | 4.55 | 2.79 | |
| T2-T1 | 8 | 3.59±0.67 | 4.55 | 2.79 | |
| M1 | T1 | 8 | 0 | 0 | 0 |
| T2 | 8 | 3.27±0.46 | 4.05 | 2.56 | |
| T2-T1 | 8 | 3.27±0.46 | 4.05 | 2.56 |
C – Canine; P1 – First premolar; P2 – Second premolar; M1 – First molar; SD – Standard deviation
Coronal view
The mean midpalatal suture separation (mm) at the nasal and palatal floor is shown in Table 7. A matched-paired t-test showed no significant differences between the suture opening at the nasal and palatal floor [P > 0.05, Table 8]. This indicated the separation of the midpalatal suture in the coronal view was parallel.
| Position | Time Periods | n | Mean±SD | Maximum | Minimum |
|---|---|---|---|---|---|
| Nasal | T1 | 8 | 0 | 0 | 0 |
| T2 | 8 | 2.53±0.53 | 3.26 | 1.81 | |
| T2-T1 | 8 | 2.53±0.53 | 3.26 | 1.81 | |
| Palatal | T1 | 8 | 0 | 0 | 0 |
| T2 | 8 | 2.92±0.59 | 3.99 | 2.03 | |
| T2-T1 | 8 | 2.92±0.59 | 3.99 | 2.03 |
SD – Standard deviation
| n | Mean±SD | Mean Difference±SD | P | Significance | |
|---|---|---|---|---|---|
| Nasal | 8 | 2.53±0.53 | 0.39±0.06 | 0.09 | NS |
| Palatal | 8 | 2.92±0.59 |
SD – Standard deviation; NS – Not significant
Alveolar bone bending
Alveolar bone bending was defined as the difference between the PAA measured at T1 and T2 for the anchored teeth. The change in mean PAA (°) at P1 and M1 on the right was 8.29° ± 13.22° and 3.06° ± 4.87°, respectively [Table 9]. The change in mean PAA (°) at P1 and M1 on the left was −2.34° ± 10.67° and 1.46° ± 5.55°, respectively. Note that P1 and M1 PAA on the right and P1 PAA on the left were measured for seven patients while M1 PAA on the left was measured for eight patients. A matched-paired t-test showed no significant difference was found between the T1 and T2 PAA values for any of the tested variables (P > 0.05) [Table 10].
| Position | Time Periods | n | Mean±SD | Maximum | Minimum |
|---|---|---|---|---|---|
| Right | |||||
| P1 | T1 | 7 | 111.12±8.96 | 125.75 | 99.65 |
| T2 | 7 | 119.41±15.97 | 146.05 | 100.75 | |
| T2-T1 | 7 | 8.29±13.22 | 30.9 | −5.75 | |
| M1 | T1 | 7 | 104.45±8.76 | 116.9 | 92.85 |
| T2 | 7 | 107.51±8.66 | 116.4 | 94.9 | |
| T2-T1 | 7 | 3.06±4.87 | 11.75 | −1.90 | |
| Left | |||||
| P1 | T1 | 7 | 110.94±10.65 | 127.5 | 94.75 |
| T2 | 7 | 108.61±6.89 | 116.15 | 100.45 | |
| T2-T1 | 7 | −2.34±10.67 | 8.5 | −22.4 | |
| M1 | T1 | 8 | 105.16±6.04 | 112.95 | 97.45 |
| T2 | 8 | 106.61±5.55 | 116.00 | 98.50 | |
| T2-T1 | 8 | 1.46±5.55 | 12.20 | −4.90 | |
SD – Standard deviation; P1 – First premolar; M1 – First molar
| Sites | Time Periods | n | Mean±SD | Mean Difference±SD | P | Significance |
|---|---|---|---|---|---|---|
| Right | ||||||
| P1 | T1 | 7 | 111.12±8.96 | 8.29±13.22 | 0.15 | NS |
| T2 | 7 | 119.41±15.97 | ||||
| M1 | T1 | 7 | 104.45±8.76 | 3.06±4.87 | 0.15 | NS |
| T2 | 7 | 107.51±8.66 | ||||
| Left | ||||||
| P1 | T1 | 7 | 110.94±10.65 | −2.34±10.67 | 0.58 | NS |
| T2 | 7 | 108.61±6.89 | ||||
| M1 | T1 | 8 | 105.16±6.04 | 1.46±5.55 | 0.48 | NS |
| T2 | 8 | 106.61±5.55 | ||||
SD – Standard deviation; P1 – First premolar; M1 – First molar; NS – Not significant
Dental tipping
Dental tipping in degrees was defined as the difference between the DTA measured at T1 and T2 for the anchored teeth. The change in mean DTA (°) at P1 and M1 on the right was 2.56° ± 5.39° and 8.01° ± 4.82°, respectively [Table 11]. The change in mean DTA (°) at P1 and M1 on the left was 9.17° ± 6.03° and 5.63° ± 2.77°, respectively. Note that P1 and M1 DTA on the right and P1 DTA on the left were measured for seven patients while M1 DTA on the left was measured for eight patients. A matched-paired t-test showed a significant difference was found between the T1 and T2 DTA values for the right M1 and left P1 and M1 positions (P < 0.05) [Table 12].
| Position | Time Periods | n | Mean±SD | Maximum | Minimum | |
|---|---|---|---|---|---|---|
| Right | ||||||
| P1 | T1 | 7 | 87.55±3.40 | 91.60 | 82.25 | |
| T2 | 7 | 90.11±4.37 | 95.90 | 82.40 | ||
| T2-T1 | 7 | 2.56±5.39 | 6.20 | −9.20 | ||
| M1 | T1 | 7 | 94.82±5.94 | 101.65 | 87.00 | |
| T2 | 7 | 102.94±7.40 | 111.10 | 93.45 | ||
| T2-T1 | 7 | 8.01±4.82 | 17.70 | 2.65 | ||
| Left | ||||||
| P1 | T1 | 7 | 90.21±5.47 | 97.75 | 79.75 | |
| T2 | 7 | 99.38±3.83 | 104.00 | 92.15 | ||
| T2-T1 | 7 | 9.17±6.03 | 18.65 | 1.35 | ||
| M1 | T1 | 8 | 98.21±3.86 | 103.05 | 92.85 | |
| T2 | 8 | 103.84±6.16 | 111.50 | 95.85 | ||
| T2-T1 | 8 | 5.63±2.77 | 9.90 | 2.00 | ||
SD – Standard deviation; P1 – First premolar; M1 – First molar
| Sites | Time Periods | n | Mean±SD | Mean Difference±SD | P | Significance |
|---|---|---|---|---|---|---|
| Right | ||||||
| P1 | T1 | 7 | 87.55±3.40 | 2.56±5.39 | 0.26 | NS |
| T2 | 7 | 90.11±4.37 | ||||
| M1 | T1 | 7 | 94.82±5.94 | 8.01±4.82 | 0.005 | ** |
| T2 | 7 | 102.94±7.40 | ||||
| Left | ||||||
| P1 | T1 | 7 | 90.21±5.47 | 9.17±6.03 | 0.007 | ** |
| T2 | 7 | 99.38±3.83 | ||||
| M1 | T1 | 8 | 98.21±3.86 | 5.63±2.77 | 0.0007 | *** |
| T2 | 8 | 103.84±6.16 | ||||
**P<0.01; ***P<0.001. SD – Standard deviation; P1 – First premolar; M1 – First molar; NS – Not significant
Buccal bone thickness
Buccal bone thickness (BBT) was measured for the first premolar (P1), mesiobuccal root of first molar (MB-M1), and distobuccal root of first molar (DB-M1) [Table 13]. Right and left P1 BBT decreased on average by 0.54 ± 0.53 mm (P < 0.05) and 0.68 ± 0.70 mm (P < 0.05), respectively. Right and left MB-M1 BBT decreased by 0.60 ± 0.46 mm and 0.39 ± 0.50 mm, respectively, while right and left DB-M1 BBT reduced by 0.49 ± 0.27 mm and 0.27 ± 0.25 mm, respectively. Matched-paired t-tests showed the reduction in buccal bone thickness for the first molars were all significant (P < 0.05) except for the mesiobuccal root of the left first molar [P > 0.05, Table 14]. Note all variables were measured for seven patients except for MB-M1 and DB-M1 on the left, which were measured for eight patients.
| Position | Time Periods | n | Mean±SD | Maximum | Minimum | |
|---|---|---|---|---|---|---|
| Right | ||||||
| P1 | T1 | 7 | 1.05±0.60 | 1.90 | 0.37 | |
| T2 | 7 | 0.51±0.74 | 1.49 | −0.56 | ||
| T2-T1 | 7 | −0.54±0.53 | 0.27 | −1.25 | ||
| MB-M1 | T1 | 7 | 1.14±0.69 | 2.15 | 0.20 | |
| T2 | 7 | 0.54±0.83 | 1.39 | −0.82 | ||
| T2-T1 | 7 | −0.60±0.46 | −0.09 | −1.43 | ||
| DB-M1 | T1 | 7 | 1.88±0.83 | 2.82 | 0.58 | |
| T2 | 7 | 1.39±0.96 | 2.79 | −0.03 | ||
| T2-T1 | 7 | −0.49±0.27 | 0.02 | −0.82 | ||
| Left | ||||||
| P1 | T1 | 7 | 1.29±1.06 | 3.48 | 0.43 | |
| T2 | 7 | 0.61±0.71 | 1.41 | −0.42 | ||
| T2-T1 | 7 | −0.68±0.70 | 0.08 | −2.07 | ||
| MB-M1 | T1 | 8 | 1.06±0.92 | 2.87 | 0.12 | |
| T2 | 8 | 0.67±0.89 | 1.78 | −0.7 | ||
| T2-T1 | 8 | −0.39±0.50 | 0.25 | −1.16 | ||
| DB-M1 | T1 | 8 | 2.00±0.98 | 3.38 | 0.83 | |
| T2 | 8 | 1.73±0.87 | 2.76 | 0.64 | ||
| T2-T1 | 8 | −0.27±0.25 | 0.06 | −0.63 | ||
P1 – First premolar; MB-M1 – Mesial buccal root of first molar; DB-M1 – Distal buccal root of first molar; SD – Standard devaition
| Sites | Time Periods | n | Mean±SD | Mean difference±SD | % reduction in bone thickness | P | Significance |
|---|---|---|---|---|---|---|---|
| Right | |||||||
| P1 | T1 | 7 | 1.05±0.60 | −0.54±0.53 | −51.4 | 0.04 | * |
| T2 | 7 | 0.51±0.74 | |||||
| MB-M1 | T1 | 7 | 1.14±0.69 | −0.60±0.46 | −52.6 | 0.01 | * |
| T2 | 7 | 0.54±0.83 | |||||
| DB-M1 | T1 | 7 | 1.88±0.83 | −0.49±0.27 | −26.1 | 0.003 | ** |
| T2 | 7 | 1.39±0.96 | |||||
| Left | |||||||
| P1 | T1 | 7 | 1.29±1.06 | −0.68±0.70 | −52.7 | 0.04 | * |
| T2 | 7 | 0.61±0.71 | |||||
| MB-M1 | T1 | 8 | 1.06±0.92 | −0.39±0.50 | −36.8 | 0.07 | NS |
| T2 | 8 | 0.67±0.89 | |||||
| DB-M1 | T1 | 8 | 2.00±0.98 | −0.27±0.25 | −13.5 | 0.02 | * |
*P<0.05; **P<0.01. P1 – First premolar; MB-M1 – Mesial buccal root of first molar; DB-M1 – Distal buccal root of first molar; SD – Standard deviation; NS – Not significant
Craniofacial expansion
Facial bony changes due to expansion treatment were evaluated at the zygomatic and infrazygomatic areas illustrated on superimposed 3D skeletal color maps [Figures 11 and 12]. Zygomatic expansion (mm) ranged from 0.44 to 1.05 mm on the right and 0.45 to 1.56 mm on the left. Infrazygomatic expansion (mm) ranged from 0.57 to 1.60 mm on the right and 0.45 to 1.56 mm on the left [Table 15]. A matched-paired t-test showed that significant differences were found between the expansion at the zygomatic and infrazygomatic area, respectively, on the left and ride sides (P < 0.05) [Table 16].
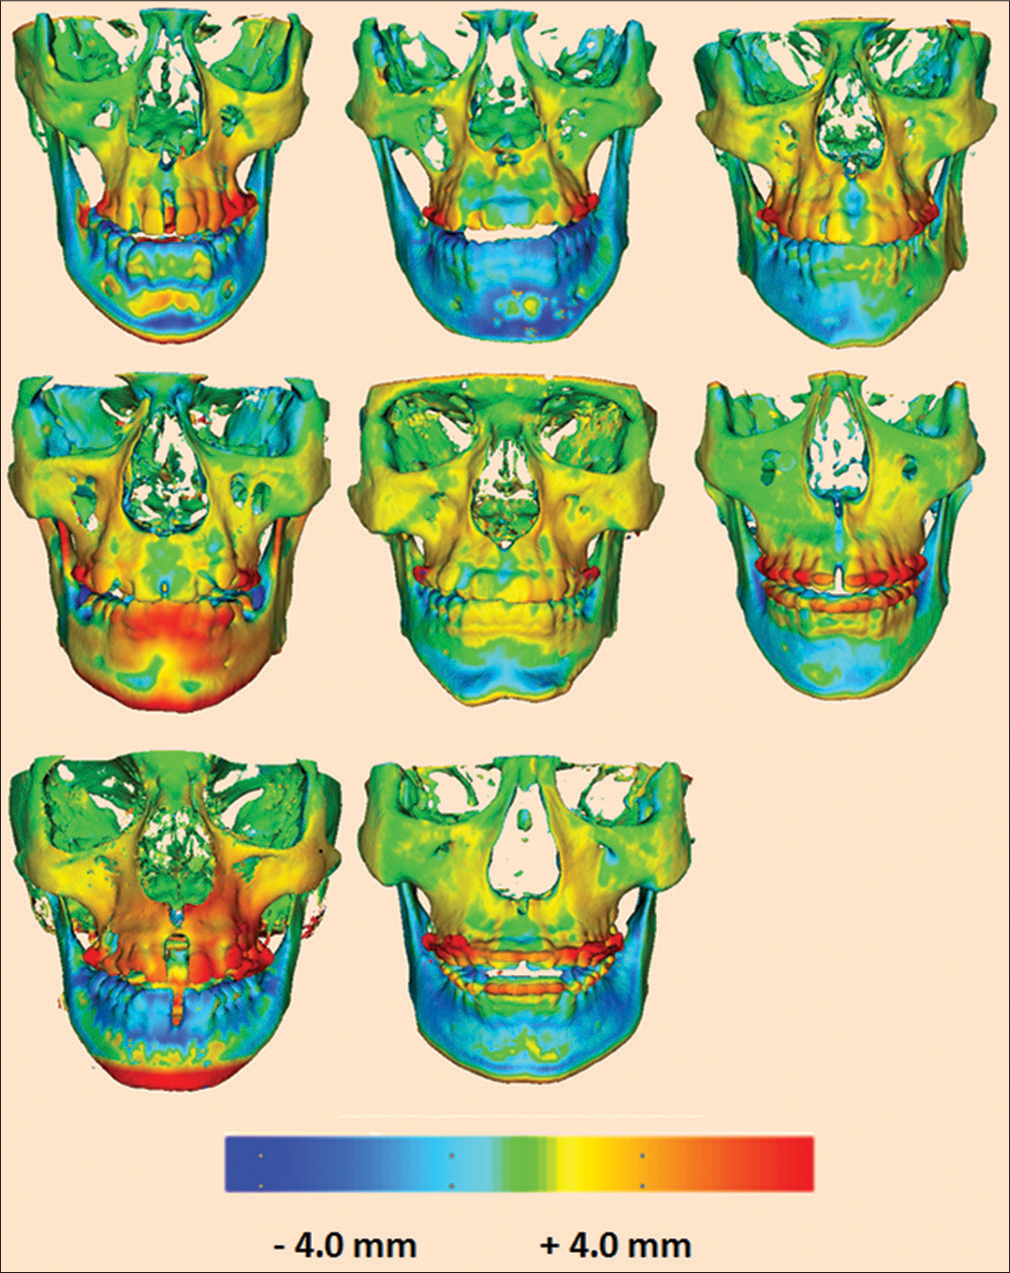
- Three-dimensional skeletal color maps of superimpositions of T2 over T1 registered at the anterior cranial base with a scale of -4 to +4 mm. Red represents outward displacement of T2 relative to T1. Blue represents inward displacement of T2 relative to T1
| Position | n | Mean±SD | Maximum | Minimum | |
|---|---|---|---|---|---|
| Right | |||||
| Zygomatic | 8 | 0.73±0.24 | 1.05 | 0.44 | |
| Infrazygomatic | 8 | 1.13±0.38 | 1.60 | 0.57 | |
| Left | |||||
| Zygomatic | 8 | 0.93±0.36 | 1.56 | 0.45 | |
| Infrazygomatic | 8 | 1.35±0.32 | 1.78 | 0.95 | |
SD – Standard deviation
| Position | n | Mean±SD | Mean difference±SD | P | Significance |
|---|---|---|---|---|---|
| Right | |||||
| Zygomatic | 8 | 0.73±0.24 | 0.04±0.14 | 0.013 | * |
| Infrazygomatic | 8 | 1.13±0.38 | |||
| Left | |||||
| Zygomatic | 8 | 0.93±0.36 | 0.42±0.04 | 0.00033 | *** |
| Infrazygomatic | 8 | 1.35±0.32 | |||
*P<0.05; ***P<0.001. SD – Standard deviation
Discussion
It is generally accepted that chronological age is not a precise index in predicting skeletal maturation,[9] and there is tremendous variability in the developmental stages of the midpalatal suture relative to chronological age.[18] While some authors noted fusion of the midpalatal suture occurred between ages 15 and 19 years,[19-21] others reported that sutures at the age of 32,[21] 54,[22] and 71 years[23] were still patent. Histological data suggested that patients who show an advanced stage of skeletal maturation may have difficulty undergoing maxillary expansion using tooth borne appliances due to formation of bony bridges across the suture.[10,20] In a recent investigation by Jang et al., midpalatal suture maturation was found to correlate better with bone maturation indices such as CVM and hand-wrist maturation.[9] The authors suggested that nonsurgical maxillary expansion may be used before stage 3 in CVM.[9]
In the present study, only patients with CVM of stage 4 or greater were assessed to determine if the MARPE appliances can be successful in obtaining orthopedic expansion in skeletally matured adults. In addition, CBCT was used to evaluate the dental, skeletal, and periodontal response to overcome the limitations of two-dimensional (2D) radiographs in superimposing anatomic structures, landmarks identification, measuring alveolar bone thickness, and position reproducibility.[24,25]
Skeletal expansion
Midpalatal suture separation
Our pilot study shows that MARPE appliance is effective in separating the midpalatal suture and correcting maxillary transverse discrepancies in nongrowing patients. This is in agreement with several other investigators.[1,7,8] All patients in the present study demonstrated successful maxillary expansion, evident by the opening of the midpalatal suture. The average TE (∆IMW) and sutural transverse expansion at the first molar, measured at the completion of appliance activation, was 6.26 ± 1.31 and 2.55 ± 0.71 mm, respectively. These results suggest that 41% of TE was attributed to skeletal expansion and 59% to dentoalveolar expansion. This is in agreement with a larger study conducted by Choi et al.[8] that reported an 87% success in obtaining orthopedic expansion in a young adult sample with 43% of TE attributed to skeletal expansion.[8] Several authors found that bone-borne expanders produced greater orthopedic changes and fewer dentoalveolar changes than tooth-borne maxillary expanders.[25,26] In addition, Graber et al.[27] noted bonded RPE and bone-anchored RPE accounted for 41% and 65% of mean maxillary basal expansion relative to mean screw expansion, respectively, in patients aged ranging between 11.3 and 17 years. The authors explained that the large expansion percentage difference was due to the direct effects that bone-anchored RPE had on the palate rather than the surrounding maxillary molars.[27]
In the present study, the percentage of greatest mean palatal expansion associated with mean screw expansion was 52%, which was less than the results reported by Graber et al. with bonded RPE.[27] However, it should be noted that patients in the present study were all skeletally matured with a mean age of 21.9 ± 9.73 years. Furthermore, the amount of skeletal expansion found in this study was similar to an investigation by Chamberland and Proffit[28] who reported approximately 46% of skeletal expansion was achieved immediately after SARPE with tooth-borne devices in patients ranging from age 15 to 54 years old.[28] In this study, both the pterygoid junction and the midpalatal suture between the incisor roots were separated,[28] which was an advantage over the current study with regard to achieving greater skeletal expansion. However, measurements were made from posteroanterior cephalograms,[28] which makes accurate comparison with this study difficult.
The pattern of midpalatal suture separation observed with MARPE in this study was found to be parallel in both the coronal and frontal perspective. The amount of suture opening at the canine, first premolar, second premolar, and first molar area differed from each other by no more than 0.47 ± 0.17 mm. This indicated that sutural expansion at the level of the palate was rather uniform anteroposteriorly, which agrees with the findings of other previous authors.[7,25] However, Lin et al.[25] demonstrated midpalatal suture opening occurred in a triangular pattern super inferiorly, with the least increase at the nasal floor and the greatest increase at the hard palate (n = 15; mean age = 18.1 ± 4.4 years). The contrasting findings may be due to the different amounts of appliance activation performed in each study. Patients received >7 mm of activation in the study by Lin et al.[25] while the appliance was activated <7 mm (mean = 5.61 ± 1.19 mm) in the present study. The larger amount of maxillary expansion attempted by Lin et al.[25] may inevitably cause the maxillary halves to tip further away from the fulcrum of rotation located close to the front maxillary suture.[29]
Nevertheless, a few patients individually demonstrated a slight V-shaped expansion pattern in this study. Variations in the suture opening pattern may be due to differences in the appliance being placed more anteriorly, on the inclines of the anterior palate distal to the second or third rugae. It has been reported that posterior positioning of the expander device may allow for application of lateral forces against the pterygomaxillary buttress bone, which would allow for more parallel separation of the maxillary halves during expansion.[7]
Upper facial bony displacement
In this study, lateral widening of the zygomatic and infrazygomatic areas as well as the nasal floor was noted following immediate end of appliance activation. Superimposed 3D skeletal colors maps showed that there was significantly greater expansion in the infrazygomatic area than the zygomatic area. The difference in pretreatment and postexpansion treatment CBCT measurements at the nasal floor also demonstrated an increase of 2.53 ± 0.53 mm in width, which was slightly larger than the expansion achieved at the infrazygomatic area by 0.05 ± 0.17 mm. This finding agrees with other studies[7,24,26,30,31] and may support the theory that maxillary expansion increases airflow and improve nasal breathing.[32]
In the frontal plane of the upper maxillofacial structures, the decreasing upward expansion effect indicated a slight triangular expansion pattern with the base at the level of the nasal floor. This observation agrees with the results of previous 2D[8] and 3D[7,33] data on bone-borne expansion. The pattern of transverse craniofacial expansion may be attributed to the stress distribution that occurred along the circummaxillary sutures, resulting in lateral rotation of the maxillary halves around the estimated center of rotation located at the frontonasal suture.[26]
Furthermore, this study showed that expansion of the zygomatic, infrazygomatic, and nasal cavity areas amounted to 30%, 44%, and 45% of the screw expansion. In a recent systematic review conducted on patients aged 6–14.5 years, it was concluded that expansion of the midpalatal suture and nasal cavity ranged from 20% to 50% and 17% to 33% of the total screw expansion, respectively.[34] Compared to the results reported in these younger patients, the data obtained in the current study indicate that effective expansion was achieved with MARPE in nongrowing patients.
Dentoalveolar expansion
Alveolar bone bending and dental tipping
In this study, the expansion of the palatal cortical plates (∆PMW) beyond that of the suture opening at the first molars was 0.73 ± 0.04 mm, which accounted for 12% of TE. This indicated the remaining fraction of TE that derived from dental tipping was 47% at the first molar (2.98 ± 0.56 mm). Similarly, Garrett et al.[35] found that alveolar bending and dental tipping contributed 13% (0.84 mm) and 49% (3.27 mm) to TE at the first molar, respectively, with the hyrax appliance in patients with a mean age of 13.8 years.[35] The results of this study have demonstrated that MARPE is effective at producing significant skeletal expansion without achieving severe dentoalveolar effects compared to conventional RPE.
Positive differences in the PAA before and immediately after MARPE for the anchoring teeth were found; however, the values did not reach statistical significance. On the other hand, significant buccal dental tipping was noted for the left first premolar and both first molars. The buccal inclination observed in the alveolar bone and teeth may be related to outward rotation of the maxillary halves during expansion as they split at the midpalatal suture, with the fulcrum at the frontomaxillary suture.[7,24,36]
In this study, absolute dental tipping was positive for the left first premolar (11.51°) and both first molars (4.96° and 4.17° for the right and left side, respectively). Since the anchoring teeth were banded and rigidly fixated to the expander, the positive buccal tipping observed may be due to parallel movement of the teeth with the appliance during active expansion.[24] Even though microimplants were used to deliver greater forces directly to the maxillary bone, the anchoring teeth may still be impacted due to possible tipping of the microimplants. The measured sutural opening immediately at the end of active expansion phase in the coronal view ranged from 3.27 mm to 3.74 mm, illustrating that the ratio of appliance activation to skeletal expansion is not 1:1.
As been stated by Chen et al.,[37] screws require mechanical locking for stability and force loading should occur at least 3 weeks after the placement procedure to avoid disturbing the primary healing of surrounding bone, which is a key factor for better stability. In this study, appliance activation occurred on the same day of placement. This may result in a weakened bone-implant interphase, which may cause unwanted forces to be transmitted to the teeth and subsequent dental tipping. Other possible causes for dental tipping of the anchoring teeth may include the lack of bicortical engagement of the microimplants, poor bone density,[37] and overwinding of the microimplant during installation.[37]
Periodontal effects
High expansion forces may produce areas of compression on the periodontal ligament of anchoring teeth and cause alveolar bone resorption that leads to decreased buccal bone thickness.[25,38] Following conventional RPE, authors of previous reports found significant reductions in buccal bone thickness[24,38] while others found no or minimal changes.[39,40] In this study, buccal bone thickness decreased by 0.27 mm to 0.60 mm for the first molars after expansion. This finding was less than the reduction of buccal bone thickness found by Gunyuz Toklu et al.[24] for the first molars (approximately 0.7–1.2 mm) in a group of patients also treated with bone-borne expansion (mean age of 13.8 years). The difference in the results may be due to the length and amount of microimplants that were used to fixate the expander device to the palate. Gunyuz Toklu et al. used two palatal miniscrews (1.8 mm × 9 mm)[24] to support the appliance while four microimplants (1.5–1.8 mm × 11 mm) were used in this study sample to promote bicortical engagement of the microimplants into the palate. The bone-borne appliance design used to treat the patients of this study may be advantageous because the use of four microimplants may direct greater expansion force toward the mipalatal suture and other resistant areas (i.e., pterygomaxillary buttress bone) and away from the anchoring teeth.[7,33] However, analysis of buccal bone thickness was performed using CBCT scans taken 3 months after the end of expansion retention in the study by Gunyuz Toklu et al.[24] The additional 3-month postexpansion may allow for greater buccal bone remodeling, and therefore, greater reductions in buccal bone reduction may be observed compared to the current study. Carlson et al.[7] also used four similar microimplants to support their bone-borne expansion device and had found thinning of the buccal plates at the maxillary first molar.
The buccal alveolar bone thickness of the right and left first premolars decreased by 0.54 and 0.68 mm on an average, respectively, in this study. The finding was slightly greater than some earlier bone-anchored expansion studies,[24] which may be due to the use of the first premolars as additional support for the bone-borne device in some patients in the current study. Gunyuz Toklu et al.[24] explained the buccal periodontal support of the first premolars remained unchanged for their study because the bone-borne expander was attached to the palatal miniscrews instead of the first premolars. Other authors also showed that the alveolar crest level was maintained[38] or the reduction was not clinically important[28] for teeth that were not used for appliance anchorage.
Although thinning of buccal alveolar bone in the regions of anchoring teeth was found to be statistically significant, the periodontal effect may be reduced over time. A partial recovery of bone levels has been observed with uprighting of the teeth supporting the expansion device using fixed appliance therapy.[39] Some authors found the reduction in buccal bone thickness recovers after 3 months,[40] 6 months, and even 2 years[39] following expansion. Evidence has demonstrated that lingual tooth movement leads to coronal bone apposition on the buccal alveolar crest;[41] therefore, overcorrection of maxillary constriction during expansion may facilitate buccal bone regeneration by allowing for uprighting of anchoring teeth with fixed appliances.[38] However, due to the possibility of supporting teeth to move buccally with expansion and undergo adverse periodontal changes, clinicians should consider reduction of buccal bone thickness to be a potentially important negative consequence of expansion.[38] Patients with unfavorable periodontium who require severe maxillary transverse correction may be better suited for bone-borne SARPE.
Conclusions
Midpalatal suture separation was found in 100% of skeletally matured young adults treated with MARPE appliance with no dislodgement of microimplants. Total maxillary expansion was contributed 41% by skeletal expansion, 12% by alveolar bone bending, and 48% by dental tipping. The pattern of midpalatal suture opening was found to be parallel in both coronal and axial planes. Absolute dental tipping was found to range from 4.17° to 4.96°. The buccal bone thickness was reduced by an average of 39% measured at the premolars and molars. These findings suggest that MARPE can be a clinically acceptable, nonsurgical treatment option for correcting mild to moderate maxillary transverse discrepancies in skeletally matured young adults.
Acknowledgment
We would like to acknowledge Dr. Fernanda Angelieri for her help in evaluating sutural maturation.
Financial support and sponsorship
Nil.
Conflicts of interest
There are no conflicts of interest.
References
- Prevalence and distribution of selected occlusal characteristics in the US population, 1988-1991. J Dent Res. 1996;75:706-13.
- [CrossRef] [PubMed] [Google Scholar]
- Palatal expansion: Just the beginning of dentofacial orthopedics. Am J Orthod. 1970;57:219-55.
- [CrossRef] [Google Scholar]
- Periodontal effects of surgically assisted rapid palatal expansion evaluated clinically and with cone-beam computerized tomography: 6-month preliminary results. Am J Orthod Dentofacial Orthop. 2011;139:S117-28.
- [CrossRef] [PubMed] [Google Scholar]
- Surgically assisted rapid maxillary expansion (SARME): A review of the literature. Int J Oral Maxillofac Surg. 2005;34:709-14.
- [Google Scholar]
- Surgically assisted rapid palatal expansion: A literature review. Am J Orthod Dentofacial Orthop. 2008;133:290-302.
- [Google Scholar]
- Microimplant-assisted rapid palatal expansion appliance to orthopedically correct transverse maxillary deficiency in an adult. Am J Orthod Dentofacial Orthop. 2016;149:716-28.
- [Google Scholar]
- Nonsurgical miniscrew-assisted rapid maxillary expansion results in acceptable stability in young adults. Angle Orthod. 2016;86:713-20.
- [CrossRef] [PubMed] [Google Scholar]
- Relationship between maturation indices and morphology of the midpalatal suture obtained using cone-beam computed tomography images. Korean J Orthod. 2016;46:345-55.
- [CrossRef] [PubMed] [Google Scholar]
- The cervical vertebral maturation (CVM) method for the assessment of optimal treatment timing in dentofacial orthopedics. Semin Orthod. 2005;11:119-29.
- [Google Scholar]
- Rapid maxillary expansion. Is it better in the mixed or in the permanent dentition? Angle Orthod. 2003;73:654-61.
- [Google Scholar]
- Comparing cone beam computed tomography systems from an orthodontic perspective. Semin Orthod. 2011;17:34-8.
- [CrossRef] [Google Scholar]
- Assessment of asymmetry in a normal occlusion sample and asymmetric patients with three-dimensional cone beam computed tomography: A study for a transverse reference plane. Angle Orthod. 2012;82:860-7.
- [Google Scholar]
- Significance of the Frankfort mandibular plane angle in prosthetic management of partially or completely edentulous patients with Class II malocclusions. J Indian Prosthodont Soc. 2005;5:175-9.
- [CrossRef] [PubMed] [Google Scholar]
- Reproducibility of Frankfort horizontal plane on 3D multi-planar reconstructed MR images. PLoS One. 2012;7:e48281.
- [Google Scholar]
- Midpalatal suture maturation: Classification method for individual assessment before rapid maxillary expansion. Am J Orthod Dentofacial Orthop. 2013;144:759-69.
- [CrossRef] [Google Scholar]
- Three-dimensional assessment of maxillary changes associated with bone anchored maxillary protraction. Am J Orthod Dentofacial Orthop. 2011;140:790-8.
- [Google Scholar]
- Diagnostic performance of skeletal maturity for the assessment of midpalatal suture maturation. Am J Orthod Dentofacial Orthop. 2015;148:1010-6.
- [Google Scholar]
- Growth in width of the maxilla studied by the implant method. Scand J Plast Reconstr Surg. 1974;8:26-33.
- [Google Scholar]
- Palatal growth studied on human autopsy material. A histologic microradiographic study. Am J Orthod. 1975;68:42-54.
- [Google Scholar]
- Palatal suture closing in man from 15-35 years of age. Am J Orthod Dentofacial Orthop. 1977;72:42-52.
- [Google Scholar]
- Age-related changes in the midpalatal suture. A histomorphometric study. J Orofac Orthop. 2004;65:467-74.
- [Google Scholar]
- Age-dependent three-dimensional microcomputed tomography analysis of the human midpalatal suture. J Orofac Orthop. 2007;68:364-76.
- [CrossRef] [Google Scholar]
- Periodontal, dentoalveolar, and skeletal effects of tooth-borne and tooth-bone-borne expansion appliances. Am J Orthod Dentofacial Orthop. 2015;148:97-109.
- [CrossRef] [Google Scholar]
- Tooth-borne vs. bone-borne rapid maxillary expanders in late adolescence. Angle Orthod. 2015;85:253-62.
- [CrossRef] [PubMed] [Google Scholar]
- Comparison of transverse changes during maxillary expansion with 4-point bone-borne and tooth-borne maxillary expanders. Am J Orthod Dentofacial Orthop. 2015;148:599-607.
- [CrossRef] [PubMed] [Google Scholar]
- Orthodontics: Current Principles and Techniques (6th ed). St. Louis: Mosby; 2016.
- Short-term and long-term stability of surgically assisted rapid palatal expansion revisited. Am J Orthod Dentofacial Orthop. 2011;139:815-220.
- [Google Scholar]
- Analysis of rapid maxillary expansion using Cone-Beam computed tomography. Dent Press J Orthod. 2010;15:107-12.
- [CrossRef] [Google Scholar]
- Does rapid maxillary expansion have long-term effects on airway dimensions and breathing? Am J Orthod Dentofacial Orthop. 2011;140:146-56.
- [CrossRef] [PubMed] [Google Scholar]
- Airway compartments volume and oxygen saturation changes after rapid maxillary expansion: A longitudinal correlation study. Angle Orthod. 2015;85:955-61.
- [Google Scholar]
- Rapid expansion of the maxillary dental arch and nasal cavity by opening the mid-palatal suture. Angle Orthod. 1961;47:186-92.
- [Google Scholar]
- Stress distribution and displacement by different bone-borne palatal expanders with micro-implants: A three-dimensional finite-element analysis. Eur J Orthod. 2014;36:531-40.
- [Google Scholar]
- Palatal expansion in adults: The surgical approach. Am J Orthod Dentofacial Orthop. 2011;140:463. 465, 467
- [Google Scholar]
- Skeletal effects to the maxilla after rapid maxillary expansion assessed with cone-beam computed tomography. Am J Orthod Dentofacial Orthop. 2008;134:8-9.
- [Google Scholar]
- Cone-beam computerized tomography evaluation of the maxillary dentoskeletal complex after rapid palatal expansion. Am J Orthod Dentofacial Orthop. 2010;138:486-92.
- [CrossRef] [PubMed] [Google Scholar]
- Stability of miniplates and miniscrews used for orthodontic anchorage: Experience with 492 temporary anchorage devices. Clin Oral Implants Res. 2008;19:1188-96.
- [Google Scholar]
- Periodontal effects of rapid maxillary expansion with tooth-tissue-borne and tooth-borne expanders: A computed tomography evaluation. Am J Orthod Dentofacial Orthop. 2006;129:749-58.
- [Google Scholar]
- A cone-beam computed tomography evaluation of buccal bone thickness following maxillary expansion. Imaging Sci Dent. 2013;43:85-90.
- [CrossRef] [PubMed] [Google Scholar]
- Facioskeletal and dental changes resulting from rapid maxillary expansion. Angle Orthod. 1966;36:152-64.
- [CrossRef] [Google Scholar]
- Bone regeneration in alveolar bone dehiscences related to orthodontic tooth movements. Eur J Orthod. 1983;5:105-14.
- [CrossRef] [PubMed] [Google Scholar]


