Translate this page into:
Skull bone thickness versus malocclusion
Address for correspondence: Dr. Mahamad Iqbal D. K., Department of Orthodontics and Dentofacial Orthopaedics, Yenepoya Dental College, Yenepoya University, Mangalore, Karnataka, India. E-mail: driqbaldk@ hotmail.com
This article was originally published by Wolters Kluwer and was migrated to Scientific Scholar after the change of Publisher.
Abstract
Objective
The objectives of this study were to determine the thickness of skull bones, namely frontal, parietal, and occipital bones in Class I, Class II, and Class III patients.
Materials and Methods
Three hundred subjects who reported to the Department of Orthodontics requiring orthodontic treatment within the age group 17-35 were selected for the study. They were subdivided into three groups of 100 each according to the skeletal and dental relation. Profile radiographs were taken and the tracings were then scanned, and uploaded to the MATLAB 7.6.0 (R 2008a) software. The total surface areas of the individual bones were estimated by the software, which represented the thickness of each bone.
Result
Frontal bone was the thickest in Class III malocclusion group and the thinnest in Class II malocclusion group. But the parietal and occipital bone thickness were not significant. During gender differentiation in Class I, malocclusion group frontal bone thickness was more in males than females, In Class II, malocclusion parietal bone thickness was more in males than females. No statistically significant difference exists between genders, in Class III malocclusion group. During inter-comparison, the frontal bone thickness was significant when compared with Class I and Class II malocclusion groups and Class II and Class III malocclusion groups.
Conclusion
The differences in skull thickness in various malocclusions can be used as an adjunct in diagnosis and treatment planning for orthodontic patients. It was found that the new method (MATLAB 7.6.0 [R 2008a] software) of measuring skull thickness was easier, faster, precise, and accurate.
Keywords
Malocclusion
skull bone thickness
software
INTRODUCTION
Although orthodontics has progressed to a great extent, there are still some malocclusions which are difficult to treat. Such malocclusions many a times also have a skeletal component. A significant change in the skull thickness has been reported with age.[1] Few studies have also shown that there exists a relationship between the thickness of skull bones and dento-skeletal malocclusions.[2,3]
Jacobsen et al. found that the patients with deepbite have a general thickening of the skull[2] and they also found that there was reduced skull thickness in the occipital area and a thickening of the frontal bone in females with skeletal Class II when compared with Class I malocclusion.[1] Studies on sella turcica and cervical vertebrae revealed that there may be an association between the malocclusion and thickness of the bone in general.[4,5] Studies have also shown a connection between the thickness of the buccal cortical bone and the gonial angle[6] and have determined that the width of the ramus mandibulae varies in retrognathic and prognathic patients.[7]
Bjork observed that sturdily built children respond better to the orthodontic treatment, due to greater growth activity.[8] Skull thickness is considered to be important for orthodontic treatment planning, as it could be an indicator for the thickness of the bone which in turn could influence the treatment time.[2] Hence, skull thickness is important for the orthodontic treatment planning.
Different methods have been used to measure the human skull thickness. Anthropological material and biopsy samples from cadavers have been measured using a caliper.[9-11] Cephalometric analysis using radiographs has also been used in anthropologic and clinical studies. [3,9] Cephalometric measurement of the skull thickness has limitations and errors, which may be overcome by using the latest computer technology and software design.
In this study, we used a new method for measuring the skull thickness in skeletal Class I, Class II, and Class III subjects using computer software (MATLAB 7.6.0 [R 2008a], The Math works Inc., Massachusetts, USA).
MATERIALS AND METHODS
Three hundred subjects who reported to the Department of Orthodontics requiring orthodontic treatment within the age group 17-35 were selected for the study. They were subdivided into three groups of 100 each according to the skeletal and dental relation. The profile radiographs were recorded using cephalostat with a film-to-focus distance of 180 cm and a film-to-median plane distance of 10 cm. Profile radiograph [Figure 1] was used instead of lateral cephalogram so as to record the full orofacial skeleton. Each of the profile radiographs was traced[12] and following cephalometric reference points were marked.
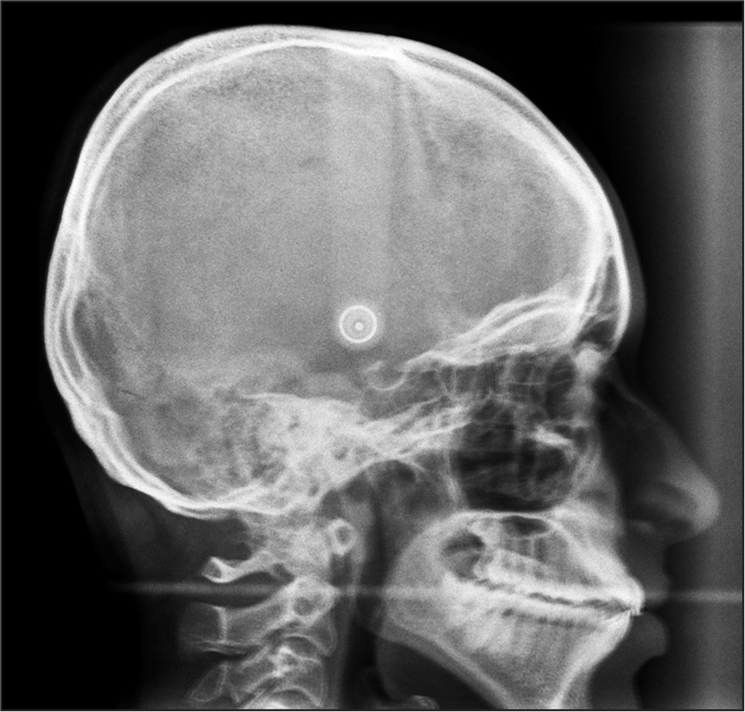
- Profile radiograph of the patient
Nasion (N)
The most anterior point on the fronto-nasal suture.
Bregma (br)
The intersection between the sagittal and coronal sutures on the surface of the cranial vault.
Lambda (l)
The intersection between the lambdoid and sagittal sutures on the surfaces of the cranial vault.
Opisthion (Op)
The midpoint of the posterior margin of foramen magnum situated above the floor of the posterior cranial fossa.[13,14]
These four points divide the skull to be measured into three different areas [Figure 2].
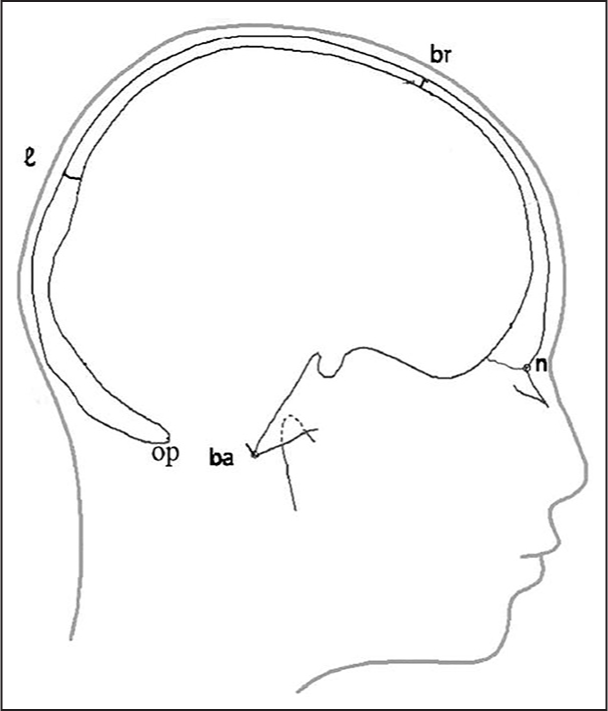
- Outline of the profile radiograph. Four points: Nasion, bregma, lambda, and opisthion divide the skull into three areas to be measured
All the tracings were then scanned using a Scanner (Hewlett-Packard, F 2248, California, USA), decreasing the magnification to 50% of the original size. To determine the skull thickness in relation to parietal, occipital, and frontal bone, each of these bones was divided into three sections. The three sectioned areas in each bone constitute one inch wide area around the midpoint of each bone and one inch wide area on either end of the each bone. These selected areas were allotted different colors which are individually painted using Microsoft paint 2007 version. Frontal bone sections were painted with red color, parietal bone with black, and occipital with green [Figure 3]. After this, the images were uploaded to the MATLAB 7.6.0 (R 2008a, The Math works Inc., Masschusetts, USA) software. The total surface area of three sections in each bone was estimated by the number of pixels present in the colored areas, of which average was taken. This represents the thickness of each bone. The readings were recorded in the computer.
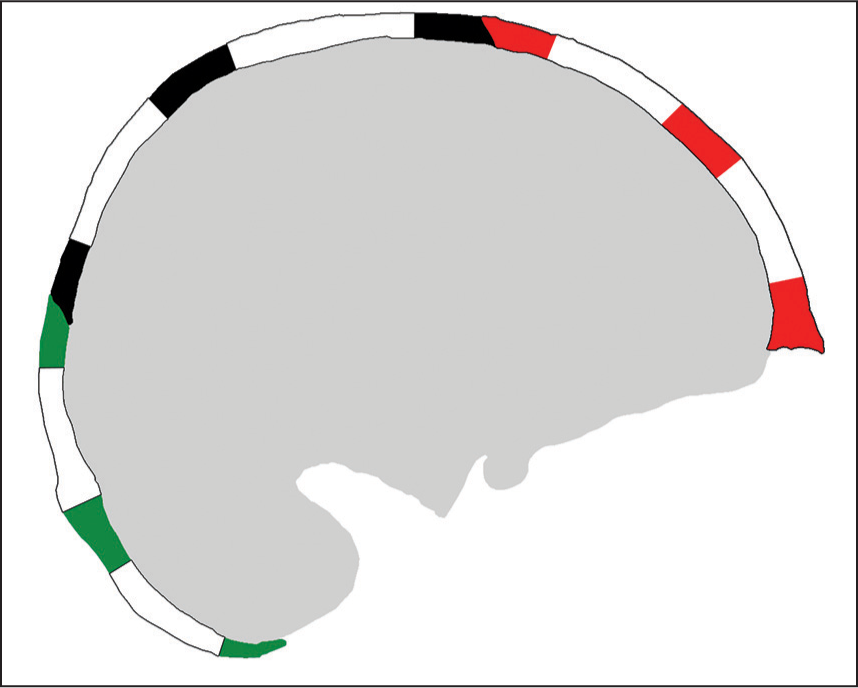
- Colored areas representing the three different sections in bones of the skull
RESULTS
The normality distribution was assessed by the Shapiro-Wilks w-test. The thickness of the frontal, parietal, and occipital bones was normally distributed except for the frontal bone in Class II and parietal bone in Class III.
Differences in the medians of the thickness of the frontal, parietal, and occipital bones between the Class I, Class II, and Class III malocclusion groups were assessed by Kruskal-Wallis test. Difference between the skull thickness in Class I and Class II malocclusion group, Class II and Class III malocclusion group, and Class I and Class III malocclusion group was assessed by post hoc analysis, using Bonferroni’s correction. Differences in the medians of the thickness of the frontal, parietal, and occipital bones between genders were assessed by Mann-Whitney U-test. The statistical analysis was performed using PASW statistics 18 software, (IBM, Hong Kong).
Pixels in the frontal, parietal, and occipital bone in Class I, Class II, and Class III groups were measured using MATLAB 7.6.0 (R 2008a) software and tabulated. The median and interquartile range values were calculated [Table 1].
| Parameters | Categories | N | Min | Max | Median | Interquartile range |
|---|---|---|---|---|---|---|
| Frontal (sq pixels) | Class I | 100 | 1723 | 3760 | 2691 | 753 |
| Class II | 100 | 1936 | 3204 | 2228 | 481 | |
| Class III | 100 | 1985 | 4026 | 2741 | 826 | |
| Parietal (sq pixels) | Class I | 100 | 2510 | 4744 | 3564 | 926 |
| Class II | 100 | 2685 | 4179 | 3305 | 817 | |
| Class III | 100 | 2010 | 4448 | 3263 | 701 | |
| Occipital (sq pixels) | Class I | 100 | 1580 | 3005 | 2322 | 660 |
| Class II | 100 | 1743 | 3200 | 2330 | 460 | |
| Class III | 100 | 1577 | 2604 | 2097 | 415 |
Based on the median values obtained [Table 1], it was observed that the parietal bone was the thickest bone in all the three malocclusion groups. The thinnest bone in Class I and Class III malocclusion groups was occipital bone whereas in Class II group the frontal bone was the thinnest.
Gender differences in the measurement of the skull bones (frontal, parietal, and occipital bone) in all the three malocclusion groups were noted and the median values and the interquartile range were calculated for Class I [Table 2], Class II [Table 3], and Class III [Table 4].
| Parameters | Categories | N | Min | Max | Median | Interquartile range |
|---|---|---|---|---|---|---|
| Frontal (sq pixels) | Male | 50 | 2236 | 3760 | 2904 | 657 |
| Female | 50 | 1723 | 3153 | 2349 | 746 | |
| Parietal (sq pixels) | Male | 50 | 2510 | 4504 | 3564 | 586 |
| Female | 50 | 2689 | 4744 | 3353 | 1481 | |
| Occipital (sq pixels) | Male | 50 | 1755 | 3005 | 2333 | 666 |
| Female | 50 | 1580 | 2704 | 2089 | 767 |
| Parameters | Categories | N | Min | Max | Median | Interquartile range |
|---|---|---|---|---|---|---|
| Frontal (sq pixels) | Male | 50 | 1961 | 3204 | 2506 | 621 |
| Female | 50 | 1936 | 3077 | 2140 | 220 | |
| Parietal (sq pixels) | Male | 50 | 2685 | 4179 | 3701 | 565 |
| Female | 50 | 2696 | 3800 | 3254 | 519 | |
| Occipital (sq pixels) | Male | 50 | 1743 | 2898 | 2451 | 512 |
| Female | 50 | 1893 | 3200 | 2209 | 429 |
| Parameters | Categories | N | Min | Max | Median | Interquartile range |
|---|---|---|---|---|---|---|
| Frontal (sq pixels) | Male | 50 | 1985 | 4026 | 2960 | 1065 |
| Female | 50 | 2228 | 3816 | 2490 | 705 | |
| Parietal (sq pixels) | Male | 50 | 2154 | 4448 | 3470 | 281 |
| Female | 50 | 2010 | 3733 | 3256 | 1111 | |
| Occipital (sq pixels) | Male | 50 | 1910 | 2495 | 2123 | 530 |
| Female | 50 | 1577 | 2604 | 2086 | 460 |
It was observed that the parietal bone was the thickest bone in males as well as females in all the three malocclusion group. The thinnest bone in males in all the three malocclusion groups was occipital bone. Similarly, the occipital bone was the thinnest bone in females in Class I and Class III malocclusion group, whereas in Class II malocclusion frontal bone was the thinnest.
Results show that statistically significant differences exist between the three groups in the frontal bone thickness (the most significant being in Class III followed by Class I and Class II). But parietal and occipital bone thickness were not significant [Table 5].
| Class | N | Median (25th, 75th) | Minmum | Maximum | Mean Rank | Chi square | P value | |
|---|---|---|---|---|---|---|---|---|
| Frontal bone measurement | I | 100 | 2508.0 | 1723.00 | 4026.00 | 34.35 | 12.107 | 0.002 |
| II | 100 | 18.90 | ||||||
| III | 100 | 35.89 | ||||||
| Parietal bone measurement | I | 100 | 3408.0 | 2010.00 | 4744.00 | 34.30 | 3.508 | 0.173 |
| II | 100 | 29.63 | ||||||
| III | 100 | 24.03 | ||||||
| Occipital bone measurement | I | 100 | 2215.0 | 1577.00 | 3200.00 | 31.98 | 5.345 | 0.069 |
| II | 100 | 33.83 | ||||||
| III | 100 | 21.94 |
Further statistical analysis (Post-hoc analysis) was done to find out whether the difference in the frontal bone thickness is between Class I and II malocclusion groups, or Class II and III malocclusion groups, or Class I and III malocclusion groups, using Bonferroni’s correction [Table 6].
| Compariso groups | N | Mean Rank | Median | Z | P value |
|---|---|---|---|---|---|
| Class I | 100 | 26.05 | 2691 | −3.003 | 0.003 |
| Class II | 100 | 14.95 | 2228 | ||
| Class II | 100 | 26.05 | 2228 | −2.953 | 0.003 |
| Class III | 100 | 20.28 | 2741 | ||
| Class I | 100 | 26.05 | 2691 | −0.409 | 0.682 |
| Class III | 100 | 20.28 | 2741 |
Differences in the medians of the thickness of the frontal, parietal, and occipital bones between the Class I, Class II, and Class III malocclusion groups were assessed by Kruskal-Wallis test [Table 5].
Results showed that the frontal bone thickness was statistically significant while comparing Class I and Class II malocclusion groups (the difference being 463 square pixels) and Class II and Class III malocclusion groups; (the difference being 513 square pixels) but there was no statistically significant difference between Class I and Class III malocclusion groups [Figures 4-6].

- Graphical representation of the frontal bone thickness measurement in Class I, Class II, and Class III malocclusion groups with median value
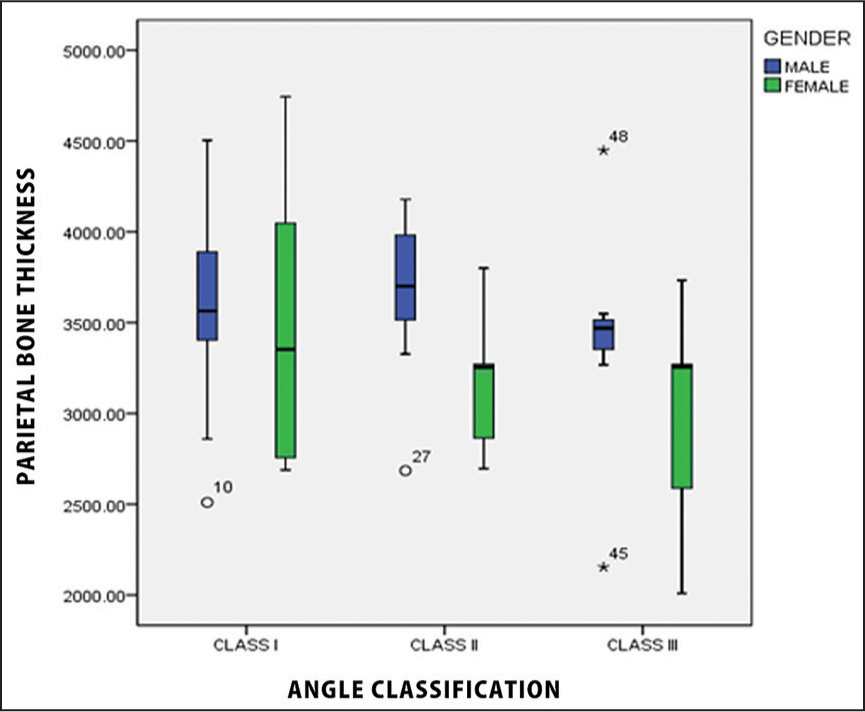
- Graphical representation of the parietal bone thickness measurement in Class I, Class II, and Class III malocclusion groups with median value
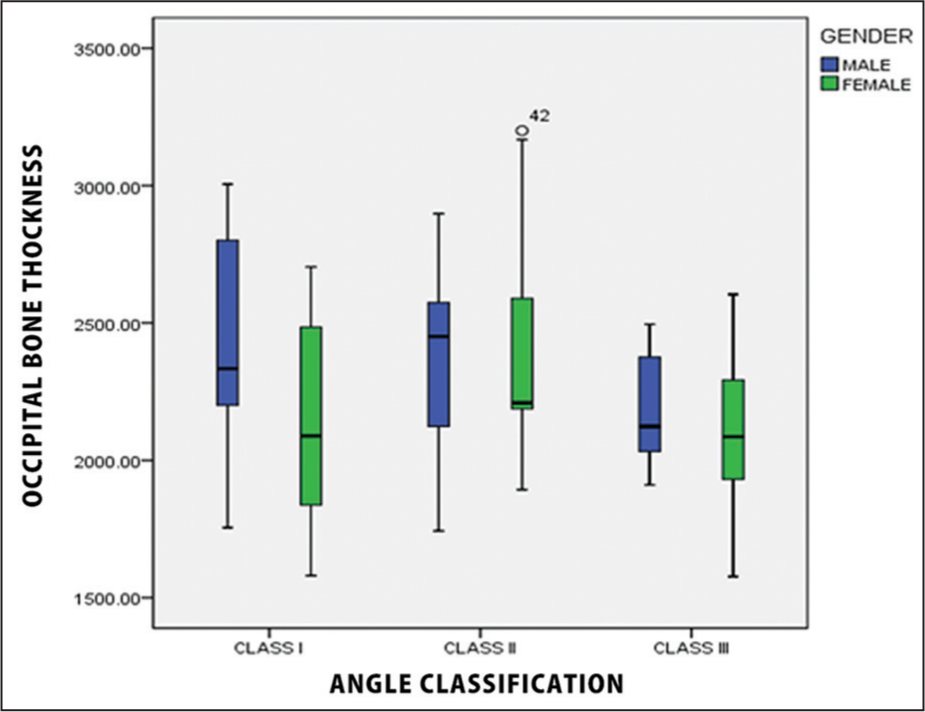
- Graphical representation of the occipital bone thickness measurement in Class I, Class II, and Class III malocclusion groups with median value
The gender differences in thickness of the skull bones frontal, parietal, and occipital bone [Tables 2-4] in all the three malocclusion groups was evaluated based on median values. To see the statistical significance of these observations Mann-Whitney U-test was done [Tables 7-9].
| Parameters | Comparison groups | N | Mean rank | Median | Z | P value |
|---|---|---|---|---|---|---|
| Frontal | Male | 50 | 12.21 | 2904 | −1.979 | 0.048 |
| Female | 50 | 6.50 | 2349 | |||
| Parietal | Male | 50 | 10.79 | 3564 | −0.33 | 0.741 |
| Female | 50 | 6.50 | 3353 | |||
| Occipital | Male | 50 | 11.86 | 2333 | −1.567 | 0.117 |
| Female | 50 | 7.33 | 2089 |
| Parameters | Comparison groups | N | Mean rank | Median | Z | P value |
|---|---|---|---|---|---|---|
| Frontal | Male | 50 | 13.00 | 2506 | −1.709 | 0.087 |
| Female | 50 | 8.45 | 2140 | |||
| Parietal | Male | 50 | 13.67 | 3701 | −2.166 | 0.03 |
| Female | 50 | 7.91 | 3254 | |||
| Occipital | Male | 50 | 9.44 | 2451 | −0.722 | 0.47 |
| Female | 50 | 11.36 | 2209 |
| Parameters | Comparison groups | N | Mean rank | Median | Z | P value |
|---|---|---|---|---|---|---|
| Frontal | Male | 50 | 11.86 | 2960 | −1.494 | 0.135 |
| Female | 50 | 8.00 | 2490 | |||
| Parietal | Male | 50 | 12.21 | 3470 | −1.723 | 0.085 |
| Female | 50 | 7.77 | 3256 | |||
| Occipital | Male | 50 | 10.86 | 2123 | −0.86 | 0.39 |
| Female | 50 | 8.64 | 2086 |
The statistical analysis showed [Tables 7-9]:
Frontal bone thickness was more in males than females and was statistically significant in Class I malocclusion group, (P = 0.048).
Parietal bone thickness was more in males than females and was statistically significant in Class II malocclusion group (P = 0.03).
No statistically significant difference exists between genders in Class III malocclusion group.
DISCUSSION
The skull thickness is considered important for orthodontic treatment planning. It could be an indicator of skeletal malocclusion and the thickness of other bones, in general, which in turn can be used to estimate the treatment time for the existing malocclusion. In 1954, Bjork found that men with skeletal sturdiness had a tendency to scissors bite and larger dental arches when compared with the slender built male patients.[8] These results suggest a connection between the thickness of the bone in general and malocclusions. In the same study, Bjork also found that sturdily built children respond better to the orthodontic treatment, explained by a greater growth activity.[8] These studies indicate that there may be an association between malocclusion, orthodontic treatment, and thickness of the bone in general.
This study evaluated the thickness of the skull in various skeletal and dental malocclusions, namely frontal, parietal, and occipital bones in Class I, Class II, and Class III patients. The bone which showed the most variation in different groups was determined.
There was a significant difference in the skull thickness among all the three classes of malocclusion. Based on the median values obtained [Table 1], it was observed that:
The parietal bone was the thickest bone in all the three malocclusion groups.
The thinnest bone in Class I and Class III malocclusion groups was occipital bone, whereas in Class II malocclusion group the frontal bone was the thinnest.
Statistical analysis of these results showed that frontal bone thickness was the most significant in Class III malocclusion group followed by Class I and Class II malocclusion group and hence, may be considered as an important factor in judging skull thickness, thus aiding in diagnosis [Table 5]. This is because, the parietal bone thickness showed more variation among all the malocclusion groups.
Inter-comparison of the frontal bone thickness in Class I, Class II, and Class III malocclusion groups showed that:
The frontal bone thickness was significant while comparing Class I with Class II and Class II with Class III malocclusion groups.
No statistically significant difference was seen between Class I and Class III malocclusion groups.
This implies that the frontal bone thickness can be used to differentiate between Class I and II malocclusion groups and Class II and III malocclusion groups, and not between Class III and I malocclusion groups. This is due to the negligible difference of the frontal bone thickness between Class I and III malocclusion group [Table 6].
Gender differences in the thickness of the skull bones showed that [Tables 2-4]:
The parietal bone was the thickest bone in males as well as females in all the three malocclusion group.
The thinnest bone in males in all the three malocclusion groups was occipital bone.
The thinnest bone in females in Class I and Class III malocclusion group was occipital bone.
The thinnest bone in females in Class II malocclusion was frontal bone.
Statistical analysis of these observations showed that [Tables 7-9]:
Frontal bone thickness showed statistically significant difference between males and females in Class I malocclusion group (thickness was more in males than females).
Parietal bone thickness showed statistically significant difference between males and females in Class II malocclusion group (thickness was more in males than females).
There was no statistically significant difference between genders in Class III malocclusion group.
From this, it can be concluded that deviations in the thickness of the skull are associated with the skeletal malocclusions. It can be hypothesized that the etiology of deviations in skull thickness is different. Other studies concluded that thickening in the frontal bone might be interrelated with a short nasal bone as both areas belong to the frontonasal developmental field.[14,15] The study also pointed out that skeletal Class III malocclusion subjects have a normal nasal bone length and a normal thickness of the frontal bone.[16]
Variations in skull bone thickness may also relate to variations in other skeletal structures. Differences between skeletal Class II and Class III malocclusion have also been found in the cervical spine. It was noticed that cervical spine of skeletal Class II patients had vertebral fusions localized more cranially than the fusions in skeletal Class III.[17] These differences might be interrelated with the differences in the frontal bone in the present study.
Until now, only two studies have correlated the skull thickness and malocclusion. The first study showed increased skull thickness in subjects with skeletal deepbite of all the three skull bones.[2] The second study[1] documented differences in skull thickness in all the three skeletal malocclusions and showed reduced skull thickness in the occipital area and thickening of the frontal bone in females with skeletal Class II malocclusion when compared with females with Class I.
This study also showed a similar association of skull thickness and malocclusion, but with few more additional findings. The frontal bone was the thickest in Class III malocclusion group and the thinnest in Class II malocclusion group. However, parietal and occipital bone thickness were not statistically significant. Frontal bone thickness was more in males than females in Class I, in Class II malocclusion parietal bone thickness was more in males than females. No statistically significant difference exists between genders, in Class III malocclusion group. The differences in findings in earlier studies and our study may be attributed to racial variation.[18-20]
The earlier studies used the conventional method of measuring the skull thickness using cephalometric radiographs. Direct cephalometric measurement of the skull thickness may have few limitations and errors, which were overcome by application of the latest computer technology. An outstanding feature of this was that a new method for measuring the skull thickness in Angle’s skeletal Class I, Class II, and Class III malocclusion using computer software (Mat Lab®) was used.
The advantage of this method is:
It is easier and faster to use.
More accurate.
Precise and reliable.
CONCLUSION
From this study, it can be concluded that there was a significant difference in the skull thickness between all the three classes of malocclusion. Frontal bone was the thickest in Class III malocclusion group and the thinnest in Class II malocclusion group. Frontal bone thickness was more in males than females in Class I malocclusion groups. Furthermore, the frontal bone thickness was statistically significant while comparing Class I and Class II malocclusion groups and Class II and Class III malocclusion groups.
The parietal bone showed more thickness in males than females in Class II malocclusion group. However, occipital bone thickness had no statistically significant correlation in any malocclusion group.
It can also be concluded that the new method (MATLAB 7.6.0 [R 2008a] software) of measuring skull thickness was easier, faster, and precise.
Financial support and sponsorship
Nil.
Conflicts of interest
There are no conflicts of interest.
References
- Skull thickness in patients with skeletal Class II and Class III malocclusions. Orthod Craniofac Res. 2008;11:229-34.
- [Google Scholar]
- Skull thickness in patients with skeletal deep bite. Orthod Craniofac Res. 2008;11:119-23.
- [Google Scholar]
- The shape and size of the sella turcica in skeletal Class I, Class II, and Class III Saudi subjects. Eur J Orthod. 2007;29:457-63.
- [Google Scholar]
- Anomalies of the cervical vertebrae in patients with skeletal Class II malocclusion and horizontal maxillary overjet. Am J Orthod Dentofacial Orthop. 2008;133:188.e15-20.
- [Google Scholar]
- Relationship between facial types and tooth and bone characteristics of the mandible obtained by CT scanning. Angle Orthod. 1998;68:557-62.
- [Google Scholar]
- Comparison of mandibular rami width in patients with prognathism and retrognathia. J Oral Maxillofac Surg. 2006;64:1506-9.
- [Google Scholar]
- Bite Development and Body Build. Report of the Thirtieth Congress. Eastbourne, UK: European Orthodontic Society; 1954. p. :123-8.
- Cranial thickness in relation to age, sex and general body build in a Danish forensic sample. Forensic Sci Int. 2001;117:45-51.
- [Google Scholar]
- Longitudinal cephalometric standards for the neurocranium in Norwegians from 6 to 21 years of age. Eur. J Orthod. 2003;25:185-98.
- [Google Scholar]
- Orthodontic Cephalometry. London: Mosby-Wolfe; 1995.
- Kjær I, Keeling JW, Hansen BF, eds. The Prenatal Human Cranium-Normal and Pathologic Development. Copenhagen: Munksgaard; 1999. p. :79-82. 116-33
- Lengths of the maxillary central incisor, the nasal bone, and the anterior cranial base in different skeletal malocclusions. Acta Odontol Scand. 2009;67:265-70.
- [Google Scholar]
- Cervical column morphology in patients with skeletal Class III malocclusion and mandibular overjet. Am J Orthod Dentofacial Orthop. 2007;132:427.e7-12.
- [Google Scholar]
- Postnatal growth of the frontal and parietal bones in white males. Am J Phys Anthropol. 1957;15:367-86.
- [Google Scholar]
- Thickness of the normal skull in the American Blacks and Whites. Am J Phys Anthropol. 1975;43:23-30.
- [Google Scholar]


