

Translate this page into:
Evaluation of various anthropometric proportions in Indian beautiful faces: A photographic study
Address for correspondence: Dr. Saaransh Kalra, Department of Orthodontics and Dentofacial Orthopaedics, School of Dental Sciences, Sharda University, Knowledge Park III, Greater Noida, Uttar Pradesh, India. E-mail: saaransh_kalra@yahoo.com
This article was originally published by Wolters Kluwer and was migrated to Scientific Scholar after the change of Publisher.
Abstract
Introduction
The subject of beauty has been the topic of much debate throughout history, and methods for the evaluation of beauty have been the focus of many research projects. The evaluation of beauty is influenced by factors which include various linear measurements, angles, ratios, and proportions. We evaluated several ratios in Indian Population after locating various landmarks on beautiful Indian faces.
Aims and Objectives
The aim of the present study was to evaluate various facial proportions of Indian beauties using their frontal photographs in natural head position to establish anthropometric norms in beautiful Indian females. To evaluate whether these values satisfy golden and silver proportions. To compare these values with Caucasian anthropometric norms.
Materials and Methods
Frontal photographs of 30 female celebrities were downloaded from the internet. Photographs of only those Indian beauties that have been declared winners of either national or international beauty contests by a designated panel of judges were included in this study. Hardcopy of these photographs was taken in 5 inch by 3.5 inch format, all the measurements done and ratios calculated.
Results
Measurements were tabulated and values for various ratios were calculated to establish norms. Coefficient of variation was also evaluated.
Conclusion
All the ratios were found to be consistent than others which made it possible to assess beauty objectively rather than arbitrarily. Most of the values did not match the golden and silver proportion. In comparison with Caucasian population, we found that there is significant difference in most of the values.
Keywords
Anthropometric
beautiful
faces
Indian
photographic

INTRODUCTION
Measurements of the human face have been performed since the Greek era. Many aspects of the ancient measurements can still be found in modern clinical anthropometry.[1-3] After the advent of cephalometry more and more stress was laid on the lateral cephalograms and the data provided them to decide the treatment plan. More emphasis was laid on achieving an ideal dental and skeletal relationship, and soft-tissue changes, if any, were given lesser priority.[4] But, in the current era of soft-tissue paradigm, it becomes imperative to give more consideration to the soft tissue facial measurements on patients photographs rather than blindly following hard tissue cephalometric norms in treatment planning.[5,6]
Even today, many orthodontists show more dependence on hard tissue cephalometric data rather than final soft tissue results. It is quite ironical that even for observing soft tissue proportions, a lateral cephalogram is given more importance rather than the patient’s photographs.
Cephalometry has its own disadvantages: First, population from which mean data are taken is not always clear. Second, most of the data presented are two-dimensional in nature and thus incomplete. Finally, some of the data have been taken from studies that were done long ago and so do not count the population changes that have occurred or are occurring.
With the changing trends, orthodontist world over are more concerned about facial esthetics rather than ideal dental and skeletal relationship. More stress is being laid on finding out golden or divine proportions for achieving a good facial esthetics for the patients.
Therefore, in order to provide relevant information regarding esthetics, we need to rely more on the soft-tissue measurements and for this, we need to consider an important source of evidence that has been neglected for a long time — Anthropometry.[7]
Most of the patients who visit orthodontists do so for esthetic reasons and it becomes necessary for an orthodontist to have some idea of various facial proportions to give an esthetically pleasing profile to his patients at the end of orthodontic treatment.[8-15] Some studies have discussed angular and linear analyses of the soft-tissue profile including ethnic differences.[16,17]
Here, we are attempting to find golden proportions by evaluating various anthropometric ratios in Indian beauties in order to achieve maximum esthetic results in the patients.
The aim of this study is to find out the average values of various anthropometric ratios in beautiful Indian faces and to compare them with the Caucasian norms to find out if any significant differences exist between them. This study will also attempt to find out if any of the ratios can be called as Golden or Divine proportion.
MATERIALS AND METHODS
Photographs of only those Indian beauties that have been declared winners of either national or international beauty contests by a designated panel of judges were included in this study. Frontal facial photographs of 30 such beautiful Indian faces were downloaded from the internet in a 5 inch by 3.5 inch format and all the important landmarks located [Figure 1]. Parallel lines were drawn so that various linear measurements can be easily measured. Ratios of these distances were calculated. Appropriate statistical tests applied and results calculated.
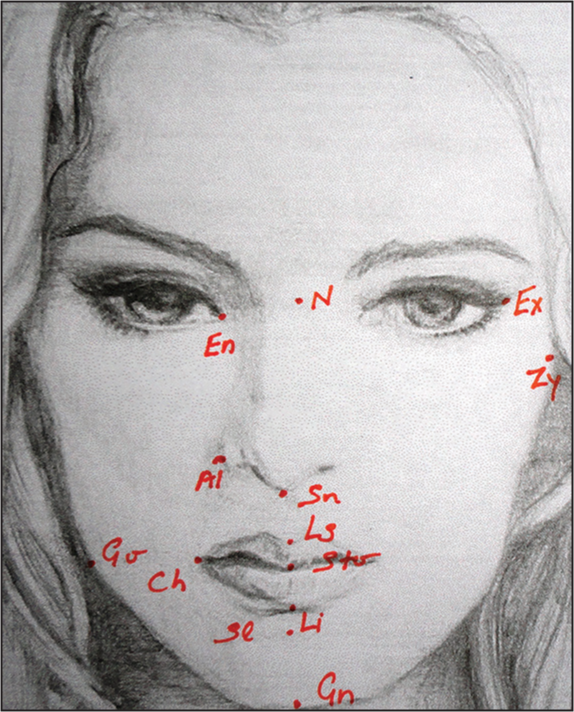
- Landmarks for soft tissue anthropometric measurements
The following landmarks are considered in this study:
N: Soft tissue nasion — the depression at the root of the nose that indicates the junction of the intranasal and the frontonasal sutures.
Sto: Stomion — median point of the oral slit when the lips are closed.
Gn: Gnathion — the lowest point on the anterior margin of the lower jaw in the midsaggital plane.
Sn: Subnasale — the point at which the nasal septum merges, in the midsagittal plane, with the upper lip.
Al: Alare — the most lateral point on the ala of the nose.
Ch: Chelion — the most lateral point of the labial fissure.
Ls: Labiale superius — midline point of the vermilion border of the upper lip, at the base of the philtrum.
Li: Labiale inferius — midline point of the vermillion border of the lower lip.
Sl: Sublabiale — midpoint along the inferior margin of the cutaneous lower lip (labiomental sulcus).
Ex: Exocanthion — apex of the angle formed at the outer corner of the palpebral fissure where the upper and the lower eyelids meet.
En: Endocanthion — the inner corner of the eye fissure where the eyelids meet.
Zy: Zygion — most lateral point of each zygomatic arch.
Go: Gonion — most inferior, posterior, and lateral point on the external angle of the mandible.
Using these landmarks, various measurements were taken and the ratios or indexes calculated, as described in Tables 1-3.
| Index | Ratios |
|---|---|
| Vertical-vertical | |
| Upper face-face height | N-Sto/N-Gn |
| Lower face-face height | Sn-Gn/N-Gn |
| Mandibulo-face height | Sto-Gn/N-Gn |
| Mandibulo upper face height | Sto-Gn/N-Sto |
| Mandibulo lower face height | Sto-Gn/Sn-Gn |
| Cutaneous-total upper lip height | Sn-Ls/Sn-Sto |
| Vermillion-total upper lip height | Ls-Sto/Sn-Sto |
| Vermillion-cutaneous upper lip height | Ls-Sto/Sn-Ls |
| Vermillion height | Ls-Sto/Sto-Li |
| Nose-face height index | N-Sn/N-Gn |
| Upper lip-upper face height | Sn-Sto/N-Sto |
| Upper lip-mandible height | Sn-Sto/Sto-Gn |
| Upper lip-nose height index | Sn-Sto/N-Sn |
| Horizontal-horizontal | |
| Intercanthal-nasal width index | En-En/AI-AI |
| Nose-mouth width index | AI-AI/Ch-Ch |
| Mandibular-face width index | Go-Go/Zy-Zy |
| Mouth face width | Ch-Ch/Zy-Zy |
| Vertical-horizontal | |
| Nasal index | AI-AI/N-Sn |
| Upper lip height-mouth width index | Sn-Sto/Ch-Ch |
| Upper face ht-biocular width index | N-Sto/Ex-Ex |
| Facial index | N-Gn/Zy-Zy |
| Upper face index | N-Sto/Zy-Zy |
| Mandibular width face height index | Go-Go/N-Gn |
| Mandibular index | Sto-Gn/Go-Go |
| Index | Ratio | Mean | SD | CV | Minimum | Maximum | SEM (sd/Vn) | Farkas’ mean |
|---|---|---|---|---|---|---|---|---|
| Vertical measurements | ||||||||
| Mandibulo-face height index | Sto-Gn/N-Gn | 0.36 | 0.01 | 0.02 | 0.34 | 0.39 | 0.0037 | 0.41 |
| Upper face-face height index | N-sto/N-Gn | 0.65 | 0.02 | 0.04 | 0.61 | 0.70 | 0.0037 | 0.61 |
| Lower face-face height index | Sn-Gn/N-Gn | 0.52 | 0.02 | 0.05 | 0.46 | 0.55 | 0.0037 | 0.59 |
| Mandibulo-lower face height index | Sto-Gn/Sn-Gn | 0.69 | 0.02 | 0.05 | 0.65 | 0.75 | 0.0037 | 0.69 |
| Nose-face height index | N-Sn/N-Gn | 0.49 | 0.03 | 0.06 | 0.44 | 0.56 | 0.0046 | 0.44 |
| Upper lip-upper face height index | Sn-Sto/N-Sto | 0.25 | 0.03 | 0.07 | 0.19 | 0.29 | 0.0048 | 0.29 |
| Lower lip-lower face height | Sto-SI/Sn-Gn | 0.31 | 0.03 | 0.08 | 0.27 | 0.39 | 0.0050 | 0.27 |
| Mandibulo-upper face height index | Sto-Gn/N-Sto | 0.55 | 0.04 | 0.12 | 0.50 | 0.64 | 0.0073 | 0.67 |
| Chin-mandible height index | Sl-Gn/Sto-Gn | 0.56 | 0.04 | 0.14 | 0.48 | 0.61 | 0.0068 | 0.63 |
| Lower lip-mandible height index | Sto-SI/Sto-Gn | 0.45 | 0.04 | 0.16 | 0.39 | 0.55 | 0.0073 | 0.37 |
| Upper lip-nose height index | Sn-Sto/N-Sn | 0.33 | 0.05 | 0.21 | 0.20 | 0.41 | 0.0084 | 0.40 |
| Upper lip-mandible height index | Sn-Sto/Sto-Gn | 0.45 | 0.05 | 0.29 | 0.34 | 0.55 | 0.0100 | 0.44 |
| Vermillion-total upper lip height index | Ls-Sto/Sn-Sto | 0.54 | 0.07 | 0.54 | 0.40 | 0.72 | 0.0120 | 0.43 |
| Cutaneous-total upper lip height index | Sn-Ls/Sn-Sto | 0.50 | 0.08 | 0.68 | 0.36 | 0.65 | 0.0150 | 0.69 |
| Lower lip-chin height index | Sto-SI/SI-Gn | 0.82 | 0.12 | 1.45* | 0.63 | 1.10 | 0.0220 | 0.60 |
| Vermillion height index | Ls-Sto/Sto-Li | 0.81 | 0.20 | 3.96* | 0.54 | 1.50 | 0.0370 | 0.87 |
| Vermillion-cutaneous upper lip height | Ls-Sto/Sn-Ls | 1.11 | 0.30 | 9.13* | 0.62 | 1.86 | 0.0550 | 0.71 |
| index | ||||||||
SD – Standard deviation; CV – Coefficient of variation; SEM – Standard error of mean; P = 0.05 is significant; P = 0.01 is highly significant
| Index | Ratio | Mean | SD | CV | Minimum | Maximum | SEM (sd/Vn) | Farkas’ mean |
|---|---|---|---|---|---|---|---|---|
| Mouth face width | Ch-Ch/Zy-Zy | 0.37 | 0.03 | 0.07 | 0.33 | 0.42 | 0.005 | 0.39 |
| Mandibular-face width index | Go-Go/Zy-Zy | 0.81 | 0.05 | 0.27 | 0.69 | 0.90 | 0.0095 | 0.71 |
| Nose-mouth width index | Alr-Alr/Ch-Ch | 0.69 | 0.06 | 0.38 | 0.53 | 0.84 | 0.0110 | 0.63 |
| Intercanthal-nasal width index | En-En/Alr-AIr | 0.86 | 0.07 | 0.50 | 0.72 | 1.03 | 0.0130 | 1.01 |
SD – Standard deviation; CV – Coefficient of variation; SEM – Standard error of mean
RESULTS
Anthropometric proportions for 24 indices were calculated in 30 Indian beauties [Table 1] and compared with the proportions of average Caucasian females as set by Farkas. These indices were classified as — vertical to vertical, horizontal to horizontal and vertical to horizontal ratios. The mean, maximum, minimum, coefficient of variation, standard deviation, and standard error were calculated and analyzed [Tables 1-5]. Furthermore, these ratios were compared to the Caucasian ratios to see if there is any significant difference between them. The closeness of these ratios to the golden and silver proportion was also analyzed.
| Index | Ratio | Mean | SD | CV | Minimum | Maximum | SEM (sd/Vn) | Farkas’ mean |
|---|---|---|---|---|---|---|---|---|
| Upper face index | N-Sto/Zy-Zy | 0.54 | 0.03 | 0.11 | 0.43 | 0.59 | 0.0060 | 0.53 |
| Mandibular index | Sto-Gn/Go-Go | 0.37 | 0.03 | 0.12 | 0.27 | 0.45 | 0.0060 | 0.51 |
| Facial index | N-Gn/Zy-Zy | 0.84 | 0.04 | 0.15 | 0.77 | 0.93 | 0.0070 | 0.87 |
| Upper face height-biocular width index | N-Sto/Ex-Ex | 0.73 | 0.04 | 0.18 | 0.64 | 0.83 | 0.0073 | 0.79 |
| Nasal index | AI-AI/N-Sn | 0.62 | 0.05 | 0.29 | 0.52 | 0.74 | 0.0099 | 0.64 |
| Upper lip height-mouth width index | Sn-Sto/Ch-Ch | 0.36 | 0.06 | 0.35 | 0.25 | 0.48 | 0.0110 | 0.40 |
| Mandibular width face height index | Go-Go/N-Gn | 0.99 | 0.09 | 0.76 | 0.83 | 1.30 | 0.0160 | 0.81 |
SD – Standard deviation; CV – Coefficient of variation; SEM – Standard error of mean; N-Sto – Nasion to stomion
| Index | Ratio | Indian Mean (n = 25) | Indian SD | 18AF mean (50) | 18AF SD | P | Result |
|---|---|---|---|---|---|---|---|
| Mandibulo-face height index | Sto-Gn/N-Gn | 0.36 | 0.01 | 0.4 | 0.01 | <0.001*** | HS |
| Upper face-face height index | N-Sto/N-Gn | 0.65 | 0.02 | 0.61 | 0.01 | <0.001*** | HS |
| Lower face-face height index | Sn-Gn/N-Gn | 0.52 | 0.02 | 0.59 | 0.03 | <0.001*** | HS |
| Mandibulo-lower face height index | Sto-Gn/Sn-Gn | 0.69 | 0.02 | 0.69 | 0.01 | >0.05 | IS |
| Nose-face height index | N-Sn/N-Gn | 0.49 | 0.03 | 0.44 | 0.01 | <0.001*** | HS |
| Upper lip-upper face height index | Sn-Sto/N-Sto | 0.25 | 0.03 | 0.29 | 0.04 | <0.001*** | HS |
| Mandibulo-upper face height index | Sto-Gn/N-Sto | 0.55 | 0.04 | 0.66 | 0.02 | <0.001*** | HS |
| Upper lip-nose height index | Sn-Sto/N-Sn | 0.33 | 0.05 | 0.4 | 0.06 | <0.001*** | HS |
| Upper lip-mandible heightt index | Sn-Sto/Sto-Gn | 0.45 | 0.05 | 0.43 | 0.05 | >0.05 | IS |
| Vermillion-total upper lip height index | Ls-Sto/Sn-Sto | 0.54 | 0.07 | 0.43 | 0.03 | <0.001*** | HS |
| Cutaneous-total upper lip height index | Sn-Ls/Sn-Sto | 0.5 | 0.08 | 0.64 | 0.14 | <0.001*** | HS |
| Vermillion height index | Ls-Sto/Sto-Li | 0.81 | 0.2 | 0.87 | 0.02 | <0.001*** | HS |
| Vermillion-cutaneous upper lip height index | Ls-Sto/Sn-Ls | 1.11 | 0.3 | 0.67 | 0.1 | <0.001*** | HS |
| Mouth face width | Ch-Ch/Zy-Zy | 0.37 | 0.03 | 0.38 | 0.02 | >0.05 | IS |
| Mandibular-face width index | Go-Go/Zy-Zy | 0.81 | 0.05 | 0.7 | 0.04 | <0.001*** | HS |
| Nose-mouth width index | Alr-Alr/Ch-Ch | 0.69 | 0.06 | 0.63 | 0.01 | <0.001*** | HS |
| Intercanthal-nasal width index | En-En/Alr-AIr | 0.86 | 0.07 | 1.01 | 0.03 | <0.001*** | HS |
| Upper face index | N-Sto/Zy-Zy | 0.54 | 0.03 | 0.52 | 0.01 | <0.001*** | HS |
| Mandibular index | Sto-Gn/Go-Go | 0.37 | 0.03 | 0.5 | 0.01 | <0.001*** | HS |
| Facial index | N-Gn/Zy-Zy | 0.84 | 0.04 | 0.86 | 0.01 | <0.05** | S |
| Upper face height-biocular width index | N-Sto/Ex-Ex | 0.73 | 0.04 | 0.79 | 0.01 | <0.001*** | HS |
| Nasal index | AI-AI/N-Sn | 0.62 | 0.05 | 0.64 | 0.01 | <0.05** | S |
| Upper lip height-mouth width index | Sn-Sto/Ch-Ch | 0.36 | 0.06 | 0.39 | 0.02 | <0.05** | S |
| Mandibular width face height index | Go-Go/N-Gn | 0.99 | 0.09 | 0.81 | 0.03 | <0.001*** | HS |
SD – Standard deviation; HS – Highly significant; S – Significant; IS – In significant
Some of the parameters have proved to be more consistent as compared to others. In vertical to vertical ratios [Figures 1 and 2] upper face-face height, lower face-face height, mandibulo-facial height, mandibulo-lower facial height, nose-facial height, upper lip-upper face height, and lower lip-lower face height indices have C.V. <1% thus making them far more reliable as compared to other parameters [Table 1]. The Tables 1-3 have been arranged in ascending order of coefficient of variation.
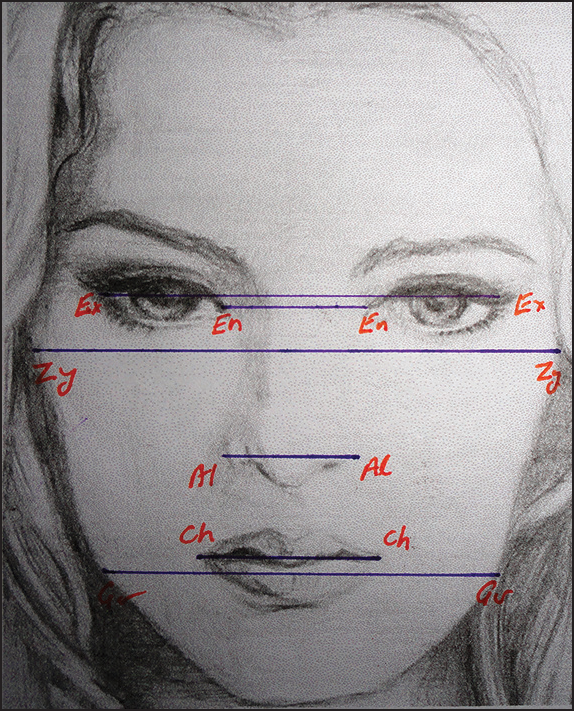
- Horizontal measurements, (1) Ex-Ex: Exocanthion to exocanthion – biocular width, (2) En-En: Endocanthion to endocanthion – intercanthal width, (3) Zy-Zy: Zygion to zygion – bizygomatic width, (4) Al-Al: Alare to alare – nasale width, (5) Ch-Ch: Chelion to chelion – mouth width, (6) Go-Go: Bigonial width – mandibular width
In vertical to vertical ratios, we have a very high coefficient of variation of vermillion cutaneous height index and a high vermillion height index thus making them far more unreliable as compared to other parameters. Lower lip chin height index also has a value of more than one percent [Table 1]. Other parameters that are quite reliable include-mandibulo upper face height index, cutaneous upper lip height index, vermillion upper lip height index, chin mandible height index, upper lip-mandible height index, upper lip-nose height index, and lower lip-mandible height index [Table 1].
In horizontal to horizontal ratios [Figures 2 and 3], mandibular face width index is the most reliable parameter with coefficient of variation of only 0.07%. Other parameters such as intercanthal-nasal width, nose-mouth width, and mandibulo-face width are quite reliable with coefficient of variation of <1% [Table 2].
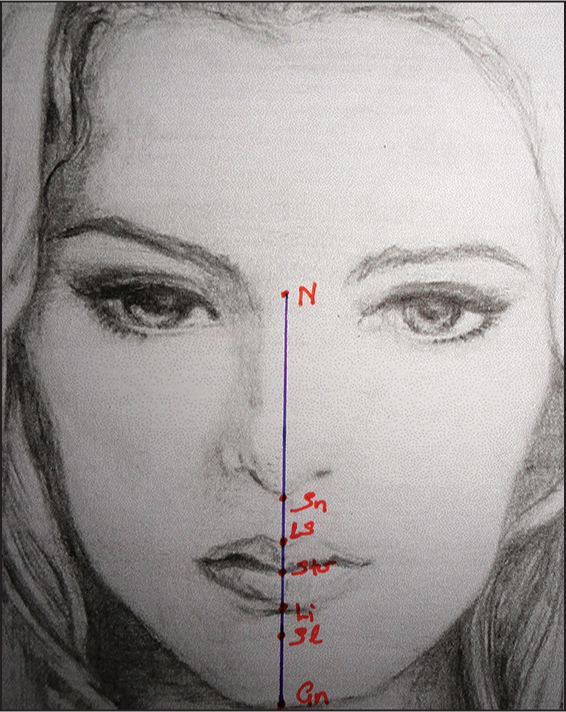
- Vertical measurements. 1) N-Sn: Nasion to subnasale – nose height, (2) Sn-Ls: Subnasale to labiale superius – cutaneous upper lip height, (3) Ls-Sto: Labiale superius to stomion – upper vermillion height, (4) Sto-Li: Stomion to labiale inferius – lower vermillion height, (5) Li-Sl: Labiale inferius to sublabiale – Lower cutaneous lip height, (6) Sl-Gn: Sublabiale to gnathion – chin height, (7) N-Sto: Nasion to stomion – upper face height, (8) Sto-Gn: Stomion to gnathion – mandibular height, (9) Sn-Gn: Subnasale to gnathion – lower face height, (10) Sn-Sto: Subnasale to stomion – upper lip height, (11) Sl-Sto: Sublabiale to stomion – lower lip height
In horizontal to vertical ratios [Figures 1-3], all the parameters are quite reliable with coefficient of variation <0.1% - nasal, upper lip height-mouth width, upper face height - buccal width, facial, mandibulo width face height, mandibular. Upper face and mandibular index have a very low standard error of mean of 0.0060 indicating a very low sample size variation [Table 3].
When compared with the Caucasian norms, which was established by Farkas in 18-year-old average Caucasian females it was found that:
Mandibulo — lower face height index, upper lip mandible height index, and mouth face width were insignificant (P > 0.05).
Facial index, nasal index, and upper lip height mouth width index have moderately significant difference from the Caucasian norms (P < 0.05).
Rest 18 parameters have highly significant difference from the Caucasian norms (P < 0.001).
While looking for the golden proportion, it was seen that only upper face to face height index, mandibulo lower face height index, nose mouth width index, and nasal index have mean values close to the golden proportion. While looking for silver proportion, it was seen that nose mouth width index and upper face height to biocular width index have mean close to the silver proportion.
DISCUSSION
Esthetic norms obtained by measuring attractive human faces enable us to make objective assessment rather than being merely subjective in evaluation of esthetics. Such people can easily be selected from cinema, television, and fashion world, who are admired by the people for their esthetics.
The present study evaluated various facial proportions in vertical and horizontal dimensions of thirty Indian beauties using their frontal photographs in upright posture to establish ideal anthropometric norms for the Indian females. Various soft-tissue landmarks have been identified on the face to measure in vertical and horizontal dimensions and calculated 24 ratios.
The anthropometric norms in Indian females were obtained in order to add objective assessment of esthetics in Indian females. These norms were then compared with the Caucasian norms as set by Farkas to see if any significant difference exists between these two population groups. The present study also discusses about the closeness of indices to the golden (divine) proportion (0.62) and the silver proportion (0.71).[1-4,8,18-20]
Yanagi introduced the concept of silver ratio which he found out in a Japanese painting. Fuji Sanjuurokkei and the Horyuji Temple in Nara City which was built in 607 AD.[14,15]
The present study aimed at the evaluation of ideal ratios rather than actual measurements to as it is the proportion that matters for judging the esthetic value of a subject whether living or nonliving rather than the actual measurements. The ratios nullify the errors in measuring the linear distances on photographs.
In vertical to vertical ratios vermillion-cutaneous upper lip height index, vermillion height index, and lower lip-chin height index showed a high variance and therefore lesser reliability for the determination of facial esthetics. The upper-face to face height index, lower face-face height index, mandibulo-upper face height index, mandibulo-lower face height index, nose-face height index, upper lip-upper face height index, and lower lip to lower face height index had minimum variance (<1%) and were found to be reliable parameters for judging facial esthetics.
The mandibulo-upper face height index, cutaneous total upper lip height index, vermillion-total upper lip height index, chin-mandible height index, upper lip-mandible height index, upper lip-nose height index, and lower lip-mandible height index fall in the middle range and can be accepted for judging the facial esthetic. The means of upper face to face height index (0.65) and mandibulo-face height index (0.69) were close to the golden proportion.
In horizontal to vertical ratios the mouth face width has a minimum variance and is very reliable for judging the facial esthetics. The intercanthal-nasal width index, nose-mouth width index, and mandibular-face width index show less variance and can be accepted as a reliable parameter for judging facial esthetics.
The mean of nose-mouth width index, which was 0.69, was close to the golden proportion. The nasal index, upper lip height-mouth width index, upper face height-biocular width index, facial index, upper face index, mandibular width face height index, and mandibular index have less variance and can be accepted as reliable parameters for judging the facial esthetics. The means of the nasal index, which was 0.62, was close to the golden proportion (0.60).
When compared with the Caucasian norms which was established by Farkas in 18-year-old average Caucasian females, it was found that 18 parameters have highly significant differences with the Caucasian norms and 3 other parameters have significant differences with the Caucasian norms and three parameters are insignificant (mandibulo-lower face height index, upper lip mandible height index, and mouth face width index) [Table 4].
Farkas has given linear measurements on average (Indian) females. These data include linear measurements rather than ratios.[21] Such studies have been done on various ethnicities in both males and females of different age groups.[22-25]
Thinking that the integumental profile is draped around the skeletal framework is wrong and therefore an independent analysis needs to be carried out for achieving esthetic benefits.
CONCLUSION
The following conclusions were drawn from the study:
Anthropometric norms for 24 variables to evaluate esthetics in Indian beauties were obtained. All the 24 variables were found to be consistent.
Three variables namely upper face-face height index, nose mouth width index, and nasal index were close to golden proportions whereas 2 variables namely vermillion-cutaneous upper lip height index and mandibular face width index were close to silver proportion.
Three out of 24 parameters considered in this study, namely mandibulo lower face height index, upper lip mandible height index, and mouth face width index were found to be comparable in both the population irrespective of ethnic variations.
Photographic analysis, despite its limitations being two-dimensional in nature, is an essential aid in soft tissue appraisal and anthropometric ratios on the soft tissue have been found to be of great value in achieving the esthetic goals.
Financial support and sponsorship
Nil.
Conflicts of interest
There are no conflicts of interest.
References
- The role of the divine proportion in the esthetic improvement of patients undergoing combined orthodontic/ orthognathic surgical treatment. Int J Adult Orthodon Orthognath Surg. 2001;16:108-20.
- [Google Scholar]
- Divine proportions in the growing face. Am J Orthod Dentofacial Orthop. 2008;134:472-9.
- [Google Scholar]
- Putative golden proportions as predictors of facial esthetics in adolescents. Am J Orthod Dentofacial Orthop. 2008;134:480-3.
- [Google Scholar]
- Assessment of facial golden proportions among young Japanese women. Am J Orthod Dentofacial Orthop. 2009;136:168-74.
- [Google Scholar]
- A measuring system for facial aesthetics in Caucasian adolescents: Reproducibility and validity. Eur J Orthod. 2005;27:579-84.
- [Google Scholar]
- Facial esthetics in adolescents and its relationship to “ideal” ratios and angles. Am J Orthod Dentofacial Orthop. 2008;133:188.e1-8.
- [Google Scholar]
- Anthropometry of the Head and Face. New York: Raven Press; 1994. p. :3-56.
- Evaluation of the Divine Proportion in the facial profile of young females. Indian J Dent Res. 2008;19:292-6.
- [Google Scholar]
- Proportionality in Asian and North American Caucasian faces using neoclassical facial canons as criteria. Aesthetic Plast Surg. 2002;26:64-9.
- [Google Scholar]
- Facial morphometry of television actresses compared with normal women. J Oral Maxillofac Surg. 1995;53:1008-14.
- [Google Scholar]
- Soft-tissue facial characteristics of attractive and normal adolescent boys and girls. Angle Orthod. 2008;78:799-807.
- [Google Scholar]
- Ideal proportions in full face front view, contemporary versus antique. J Craniomaxillofac Surg. 2011;39:107-10.
- [Google Scholar]
- Differences in craniofacial and dental characteristics of adolescent Mexican Americans and European Americans. Am J Orthod Dentofacial Orthop. 2011;140:839-47.
- [Google Scholar]
- Division of gold between the pyramids and Le Corbusier (28th ed). Tokyo: Bijitsu Syuppan; 1965. p. :26-30. 62-9
- Sequel to the division of gold between the Horyu Temple and Ukioe print: A Japanese comparison (12th ed). Tokyo: Bijitsu Syuppan; 1967. p. :27-40.
- Angular photogrammetric analysis of the soft tissue facial profile. Eur J Orthod. 2003;25:393-9.
- [Google Scholar]
- Linear photogrammetric analysis of the soft tissue facial profile. Am J Orthod Dentofacial Orthop. 2002;122:59-66.
- [Google Scholar]
- The biologic significance of the divine proportion and Fibonacci series. Am J Orthod. 1982;81:351-70.
- [Google Scholar]
- A geometric study of the facial features of Japanese people. J Jpn Plast Reconstr Surg. 1992;35:167-78.
- [Google Scholar]
- International anthropometric study of facial morphology in various ethnic groups/races. J Craniofac Surg. 2005;16:615-46.
- [Google Scholar]
- Craniofacial structure of Japanese and European-American adults with normal occlusions and well-balanced faces. Am J Orthod Dentofacial Orthop. 1996;110:431-8.
- [Google Scholar]
- Contemporary Orthodontics (3rd ed). St. Louis: Mosby; 1997. p. :153-63.
- The role of the golden proportion in the evaluation of facial esthetics. Angle Orthod. 2013;83:801-8.
- [Google Scholar]


