

Translate this page into:
Three-dimensional evaluation of the nasomaxillary complex before and following rapid maxillary expansion compared to normal subjects

*Corresponding author: Joseph Bouserhal, Department of Orthodontics, Saint Joseph University of Beirut, Beirut, Lebanon. joseph.bouserhal@usj.edu.lb
-
Received: ,
Accepted: ,
How to cite this article: Bassil-Nassif N, Bouserhal J, Mouhanna-Fattal C, Tauk A, Limme M. Three-dimensional evaluation of the nasomaxillary complex before and following rapid maxillary expansion compared to normal subjects. APOS Trends Orthod 2020;10(3):164-70.
Abstract
Objectives:
The objectives of the study were to evaluate the nasomaxillary complex (NMC) measurements before and following rapid maxillary expansion (RME) compared to normal subjects.
Materials and Methods:
Thirty consecutive patients (14 males and 16 females) with a mean age of 9.5 ± 1.8 years for males and of 11.8 ± 1.7 years for females, who underwent RME to correct their posterior unilateral or bilateral crossbite, were selected. Computed tomography (CT) scans done before treatment (BT) formed the Group BT and those after treatment constituted the Group AT. An untreated normal sample (Group NC) presenting a normal transverse occlusion and needing a cone beam CT for other purposes was formed by 30 subjects (14 males and 16 females) with a mean age of 10 ± 0.9 years for males and of 11.6 ± 1.0 years for females. The CT scans were compared between both groups BT and AT with Group NC and measurements were performed on scanned images. The mean differences between measurements were compared using the t-test (α = 0.05).
Results:
No significant differences in volumetric measurements representing the NMC were found between groups BT and NC. By comparing Group AT to NC, we found that all volumetric variables displayed statistically significant differences with an increase of those of Group AT. Linear transverse variables were increased in Group NC compared to Group BT and their differences were statistically significant. However, the same variables were larger in Group AT compared to Group NC.
Conclusion:
RME produces an increase of the NMC dimensions compared to normal controls, which supports the principle of overcorrection, needed to compensate the post-treatment relapse.
Keywords
Rapid maxillary expansion
Three-dimensional cephalometry
Transverse dimension
Normal growth

INTRODUCTION
Many studies have been conducted using posteroanterior cephalometric radiography to describe the growth pattern of dentofacial structures.[1,2] Hesby et al.[3] found that there is a pattern of width changes in the maxilla, the maxillary alveolar process, the maxillary first molars, the mandibular first molars, and the mandibular alveolar process that occurs as a gradient in the vertical dimension. The greatest width change occurs more superior and the smallest width change occurs inferiorly.
Yavuz et al.[4] noted that the increase in mandibular width was nearly twice as much as that in maxillary width. However, the increase in mandibular intermolar width was less than in maxillary intermolar width. This finding indicated the presence of a compensatory mechanism that allows the preservation of transverse normal occlusion.
Huertas and Ghafari[5] found that the majority of treated children with RME had both skeletal and dentoalveolar widths narrower than control values and the treated group was at a lower level, which is consistent with smaller maxillary widths.
Advances in technology lead to progress from 2D to 3D and from linear and angular to volumetric approaches. The use of computed tomography (CT) and later cone beam CT (CBCT) allowed to acquire 3D images, reconstruct objects, and apply 3D and volumetric measurements, leading to identify treatment effects in 3D.[6]
Miner et al.[7] noted that both the bilateral and unilateral crossbite groups had skeletally narrower maxillary widths than did the controls, but also wider mandibles, with more severe bilateral crossbites.
Deguchi et al.[8] studied the volumes of the maxilla and the mandible in subjects with different skeletal malocclusions. No differences in volume of the maxilla were found across the three class groups (Classes I, II, and III), however, differences were observed in the mandible-maxilla ratio, the subjects in the skeletal Class III group had a larger ratio compared with the Class II subjects.
Bassil-Nassif et al.[9,10] studied different facial volumes in an adult population according to the vertical facial growth pattern and identified sexual dimorphism effect on various volumetric measurements. They advocate the existence of a compensatory mechanism among the three facial dimensions to equilibrate an excess or deficit of the vertical dimension maintaining constant the total facial volume.
In a study done by Gohl et al.,[11] RPE treatment was effective in increasing the palatal volume of patients with constricted maxillary arches (21.7%) compared with growing matched controls (10.8%) and the increase in palatal volume of the rapid maxillary expansion (RME) patients was mostly due to gains in molar-to-molar and canine-to-canine widths.
Kartalian et al.[12] concluded that patients with posterior unilateral or bilateral crossbite suffered from 3.75 mm of width deficit at the base of the maxilla, and the alveolar segments were approximately 8.5° more acute than those of the controls. After treatment (AT), the base of the maxilla in the RPE patients and the alveolar angulations approached the transverse dimensions of the controls. At the dental level, the transverse widths of the RME group were greater than those of the controls by about 2.5 mm.
El and Palomo[13] found that all the transverse skeletal and interdental parameters were significantly enlarged after RME, an increase was also noted in the nasal airway volume with no significant change in the oropharyngeal airway volume.
Bouserhal et al.[14] evaluated the three-dimensional changes of the nasomaxillary complex (NMC) following RME using geometric constructions representing different constituent structures. After RME, the total volume of NMC increased by 12%, the nasal volume by 17%, and the maxillary volume by 10.6%. The maxillary and the nasal contributions represented 69.75% and 30.25%, respectively.
To the best of our knowledge, no study has been comparing treated subjects with RME to untreated controls.
The objectives of this study were to accomplish a three- dimensional volumetric, linear, and angular evaluation of the NMC in subjects presenting a posterior crossbite compared to normal controls (NCs) and to evaluate the possibility of normalization of the nasomaxillary structures after RME.
MATERIALS AND METHODS
Samples selection
The study included a treated group of thirty consecutive healthy subjects with a mean age at first observation of 9.5 ± 1.8 years for males and 11.8 ± 1.7 years for females. They presented unilateral or bilateral posterior crossbite and had undergone rapid palatal expansion procedure as part of their comprehensive treatment.
An untreated control group constituted of another 30 subjects, with a mean age at first observation of 10 ± 0.9 years for males and 11.6 ± 1 years for females, was used as a NC group. This sample was selected from the data of orthodontic patients having a normal transverse occlusion and needing a CBCT for other purposes.
The characteristics of both groups, as gender and age distribution, are presented in [Table 1]. All participants in this study had signed an informed consent form.
| Gender | Treated group | Untreated control group | ||
|---|---|---|---|---|
| Number | Mean age, y | Number | Mean age, y | |
| Male | 14 | 9.5±1.8 | 14 | 10±0.9 |
| Female | 16 | 11.8±1.7 | 16 | 11.6±1 |
| Total | 30 | 10.8±2 | 30 | 10.8±1.3 |
Data collection
The treated group had two CT scans at the beginning of treatment (T1) and at the end of RME phase (T2) as part of their records. The expansion procedure was accomplished by a tooth-borne Hyrax-type appliance with bands on upper first molars [Figure 1]. The expansion screw was activated twice a day (0.25 mm per turn, 0.5 mm daily) until posterior dental crossbite overcorrection was achieved. All radiographic examinations were performed by the same trained technician at the same scanner console and supported with a Denta-scan reconstruction program that was used to study the maxillofacial region (Prospeed, General Electric Medical Systems, Milwaukee, Wisconsin). This machine is equipped with one detector row and has a minimal rotation time of 1 s, given a collimation of 1 mm. Subsequent scans were taken with a 1 mm slice thickness, 1 mm interval, at 100 mA, with a 13.7 cm field of view, a 512 × 512 matrix, and a 0° gantry angle, and at 120 KV.

- Tooth-borne hyrax-type expansion appliance used.
The control group had a CBCT scan acquired and indicated for different diagnostic purposes. These records were realized by the same technician on the same machine (Kodak 9500 3D System, Carestream Health, Rochester, NY) and according to the following criteria: 206 mm × 184 mm large field of view, 0.3 mm slice thickness, 60–90 kv tube voltage pulsed mode, 2–15 mA tube electric power, 140 kHz frequency, AND focal point at 0.7 mm, 2 mm, and 20 s reconstruction time.
Software manipulation
The software AMIRA (Mercury Computer Systems, Berlin, Germany) was used to accomplish the rendering of all DICOM formatted images and produce 3D reconstructions as well as sagittal, axial, and coronal slices. The threshold was set at 200 and a “Data Window” of a minimum at –400 and a maximum at 4000.
The landmarks identification was done on the 3D reconstructions and controlled on xy, yz, and xz slices by the same operator for all subjects. These landmarks are presented in [Table 2].
| Nasion | NA | Midpoint the more anterior and superior of the fronto-nasal suture |
| Right nasal point | RNP | The more forward and lowest point of the antero-inferior concavity of the right nasal cavity |
| Left nasal point | LNP | The lowest point and the more forward of the antero-inferior concavity of the left nasal cavity |
| Right palatin foramen | RPF | Opening of the right greater palatine foramen |
| Left palatin foramen | LPF | Opening of the left greater palatine foramen |
| Right incisor crown | RIC | Midpoint of the upper right central incisor edge |
| Left incisor crown | LIC | Midpoint of the upper left central incisor edge |
| Right molar crown | RMC | Point of the disto-buccal cusp of upper right first molar |
| Left molar crown | LMC | Point of the disto-buccal cusp of upper left first molar |
| Right incisor apex | RIA | Apex of upper right incisor |
| Left incisor apex | LIA | Apex of upper left incisor |
| Right molar apex | RMA | Apex of the disto-buccal root of upper right first molar |
| Left molar apex | LMA | Apex of the disto-buccal root of upper left first molar |
| Basion | BA | The most inferior point of foramen magnum |
The NMC was reproduced through a geometric model constructed from these landmarks. This model consisted of two parts, as shown in [Figure 2a and b]; the nasal volume B delimited on the top by Nasion point with a base formed by nasal and palatinE foramen points right and left inferiorly, and the maxillary volume C, limited by the base of volume B, superiorly, and incisor and molar crown points right and left inferiorly. The total volume A of the NMC is the sum of volumes B and C.
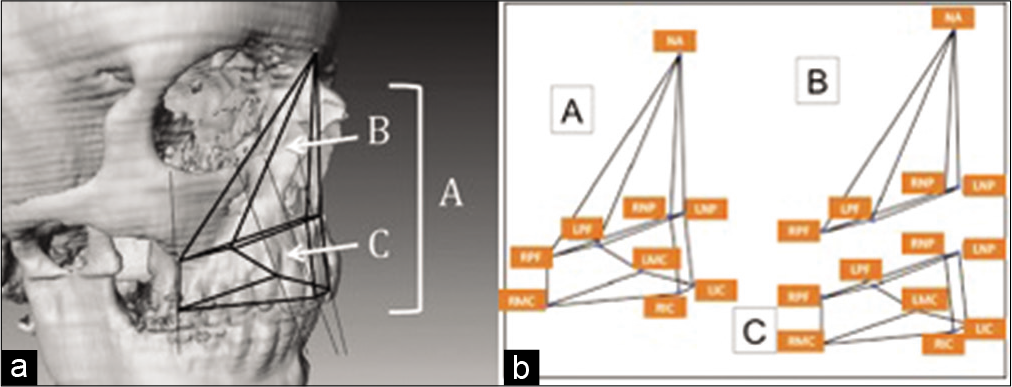
- (a and b) Structured representation of the nasomaxillary complex: B is the nasal volume and C the maxillary volume. The total volume A is the sum of B and C.
The calculation of distances, angles, and volumes was done by a software designed for this purpose using the 3D coordinates x, y, and z of different landmarks obtained from the AMIRA software.
Statistical analysis
In each group, 10 patients were randomly selected to test the intraoperator reliability and the same operator did the measurements after 2 weeks. The difference between the duplicate measurements WAS analyzed using the Pearson interclass correlation coefficient; their means were 0.832 for the linear measurements, 0.771 for the angular measurements, and 0.819 for the volumetric measurements.
Descriptive statistics were calculated for all measurements before and AT compared to NC, including means, standard deviations, and ranges. The Student’s unpaired t-test was used with the significance level set at 5% to assess if there were any significant differences among the matched pairs between means of all variables. The Kolmogorov–Smirnov test was used to verify the normality of the variables. Statistical analysis was carried out with SAS software (version 9.1, SAS Institute, Cary, NC), with a significance level of 0.05.
RESULTS
Comparison of BT group and NC group
Volumetric variables
All volumetric variables A, B and C, representing the NMC, showed no significant differences between the two groups BT and NC. The absolute values of these variables were slightly higher in the BT group [Table 3].
| Variable | BT | NC | Mean difference | PValue | ||
|---|---|---|---|---|---|---|
| Mean | SD | Mean | SD | |||
| B Volume | 4.98 | 0.90 | 4.94 | 0.97 | -0.05 | 0.842 |
| C Volume | 18.44 | 2.46 | 17.38 | 3.01 | -1.06 | 0.143 |
| A Volume | 23.42 | 2.92 | 22.32 | 3.66 | -1.10 | 0.203 |
BT indicates Before Treatment group and NC Normal Control group. Mean difference = NC-BT. * Statistically significant
Linear and angular variables
The linear vertical variables (NA-RPF, NA-LPF, NA-RMC, and NA-LMC) of the BT group presented higher absolute values than the NC group. The difference was statistically significant (P < 0.001–0.045). However, a statistically significant increase (P < 0.001–0.015) of linear transverse values (RNP-LNP, RPF-LPF, RMC-LMC, and RMA-LMA) was noted in the NC group [Table 4].
| Variable | BT | NC | Mean difference | PValue | ||
|---|---|---|---|---|---|---|
| Mean | SD | Mean | SD | |||
| NA-RNP | 4.64 | 0.34 | 4.77 | 0.25 | -0.13 | 0.114 |
| NA-LNP | 4.67 | 0.35 | 4.74 | 0.25 | -0.07 | 0.394 |
| NA-RPF | 6.94 | 0.66 | 6.67 | 0.30 | -0.27 | 0.045* |
| NA-LPF | 6.95 | 0.60 | 6.67 | 0.26 | -0.28 | 0.026* |
| NA-RIC | 7.34 | 0.43 | 7.22 | 0.40 | -0.12 | 0.283 |
| NA-LIC | 7.33 | 0.43 | 7.23 | 0.40 | -0.10 | 0.351 |
| NA-RMC | 8.10 | 0.61 | 7.60 | 0.37 | -0.50 | 0.001* |
| NA-LMC | 8.13 | 0.54 | 7.62 | 0.40 | -0.51 | 0.001* |
| NA-RIA | 5.15 | 0.42 | 5.28 | 0.34 | +0.13 | 0.187 |
| NA-LIA | 5.15 | 0.42 | 5.28 | 0.35 | +0.13 | 0.206 |
| NA-RMA | 6.49 | 0.53 | 6.30 | 0.30 | -0.19 | 0.151 |
| NA-LMA | 6.47 | 0.52 | 6.28 | 0.36 | -0.19 | 0.101 |
| RNP-LNP | 0.92 | 0.12 | 0.82 | 0.15 | -0.10 | 0.015* |
| RNP-BA | 8.39 | 0.63 | 8.35 | 0.57 | -0.04 | 0.817 |
| RNP-RPF | 3.91 | 0.33 | 4.05 | 0.30 | +014 | 0.085 |
| LNP-LPF | 3.85 | 0.32 | 3.98 | 0.26 | +0.13 | 0.115 |
| LNP-BA | 8.35 | 0.64 | 8.28 | 0.56 | -0.07 | 0.626 |
| RPF-LPF | 2.68 | 0.23 | 2.88 | 0.26 | +0.20 | 0.003* |
| RIC-LIC | 0.91 | 0.12 | 0.86 | 0.11 | -0.05 | 0.130 |
| RMC-LMC | 4.74 | 0.28 | 5.14 | 0.23 | +0.40 | 0.001* |
| RIA-LIA | 0.72 | 0.12 | 0.70 | 0.15 | -0.02 | 0.552 |
| RMA-LMA | 4.76 | 0.36 | 5.10 | 0.31 | +0.34 | 0.001* |
BT indicates Before Treatment group and NC Normal Control group. Mean difference = NC-BT. * Statistically significant.
The values of angular variables linking LNP and RNP landmarks (LNP-NA-RNP and LNP-BA-RNP) were statistically more significant (P < 0.003–0.035) in the BT group than in the NC group. However, some other angular values (RPF-NA-RNP, LPF-NA-LNP, LPF-NA-RPF, and LPF-BA- RPF) demonstrated a statistically high significant difference (P < 0.001–0.003) toward an increase in the NC group [Table 5].
| Variable | BT | NC | Mean difference | PValue | ||
|---|---|---|---|---|---|---|
| Mean | SD | Mean | SD | |||
| LNP-NA-RNP | 11.31 | 1.39 | 9.96 | 1.94 | -1.35 | 0.003* |
| LNP-BA-RNP | 6.26 | 0.91 | 5.68 | 1.16 | -0.58 | 0.035* |
| RPF-NA-RNP | 32.06 | 4.89 | 37.02 | 2.88 | +4.96 | 0.001* |
| LPF-NA-LNP | 31.63 | 4.47 | 36.01 | 2.83 | +4.38 | 0.001* |
| LPF-NA-RPF | 22.12 | 2.77 | 24.92 | 1.99 | +2.80 | 0.001* |
| LPF-BA-RPF | 32.15 | 3.72 | 36.10 | 5.77 | +3.95 | 0.003* |
BT indicates Before Treatment group and NC Normal Control group. Mean difference = NC-BT. * Statistically significant.
Comparison of AT group and NC group
Volumetric variables
All volumetric variables A, B, and C demonstrated statistically high significant differences (P < 0.001) between AT and NC groups. The absolute values of these variables were higher in the AT group [Table 6].
| Variable | AT | NC | Mean difference | PValue | ||
|---|---|---|---|---|---|---|
| Mean | SD | Mean | SD | |||
| B Volume | 5.83 | 1.00 | 4.94 | 0.97 | -0.89 | 0.001* |
| C Volume | 20.40 | 3.06 | 17.38 | 3.01 | -3.02 | 0.001* |
| A Volume | 26.23 | 3.66 | 22.32 | 3.66 | -3.91 | 0.001* |
AT indicates After Treatment group and NC Normal Control group.Mean difference = NC-AT. * Statistically significant
Linear and angular variables
The linear vertical variables (NA-RPF, NA-LPF, NA-RMC, and NA-LMC) of the AT group presented absolute values higher than the NC group, with statistically significant differences (P < 0.001–0.024). Likewise, a statistically high significant difference (P < 0.001) was found for the transverse linear values (RNP-LNP, RIC-LIC, and RIA-LIA), those of the AT group being higher than the NC group [Table 7].
| Variable | AT | NC | Mean difference | PValue | ||
|---|---|---|---|---|---|---|
| Mean | SD | Mean | SD | |||
| NA-RNP | 4.69 | 0.27 | 4.77 | 0.25 | +0.08 | 0.239 |
| NA-LNP | 4.72 | 0.28 | 4.74 | 0.25 | +0.02 | 0.731 |
| NA-RPF | 6.96 | 0.56 | 6.67 | 0.30 | -0.29 | 0.015* |
| NA-LPF | 6.93 | 0.54 | 6.67 | 0.26 | -0.26 | 0.024* |
| NA-RIC | 7.38 | 0.38 | 7.22 | 0.40 | -0.16 | 0.139 |
| NA-LIC | 7.38 | 0.39 | 7.23 | 0.40 | -0.15 | 0.133 |
| NA-RMC | 8.12 | 0.52 | 7.60 | 0.37 | -0.52 | 0.001* |
| NA-LMC | 8.15 | 0.54 | 7.62 | 0.40 | -0.53 | 0.001* |
| NA-RIA | 5.15 | 0.39 | 5.28 | 0.34 | +0.13 | 0.178 |
| NA-LIA | 5.16 | 0.40 | 5.28 | 0.35 | +0.12 | 0.221 |
| NA-RMA | 6.44 | 0.47 | 6.30 | 0.30 | -0.14 | 0.170 |
| NA-LMA | 6.45 | 0.47 | 6.28 | 0.36 | -0.17 | 0.127 |
| RNP-LNP | 1.03 | 0.15 | 0.82 | 0.15 | -0.21 | 0.001* |
| RNP-BA | 8.47 | 0.58 | 8.35 | 0.57 | -0.12 | 0.446 |
| RNP-RFP | 4.00 | 0.35 | 4.05 | 0.30 | +0.05 | 0.525 |
| LNP-LPF | 3.93 | 0.28 | 3.98 | 0.26 | +0.05 | 0.478 |
| LNP-BA | 8.43 | 0.60 | 8.28 | 0.56 | -0.15 | 0.317 |
| RPF-LPF | 2.89 | 0.27 | 2.88 | 0.26 | -0.01 | 0.908 |
| RIC-LIC | 1.00 | 0.14 | 0.86 | 0.11 | -0.14 | 0.001* |
| RMC-LMC | 5.26 | 0.27 | 5.14 | 0.23 | -0.12 | 0.065 |
| RIA-LIA | 1.00 | 0.17 | 0.70 | 0.15 | -0.30 | 0.001* |
| RMA-LMA | 5.08 | 0.41 | 5.10 | 0.31 | +0.02 | 0.852 |
AT indicates After Treatment group and NC Normal Control group.Mean difference = NC-AT. * Statistically significant.
Concerning the angular variables, the values of the angles linking landmarks LNP and RNP (LNP-NA-RNP and LNP- BA-RNP) showed statistically more significant differences (P<0.001) in the AT group than in the NC group. However, some angular values (RPF-NA-RNP and LPF-NA-LNP) demonstrated a statistically high significant difference (P < 0.001) toward an increase in the NC group [Table 8].
| Variable | AT | NC | Mean difference | P Value | ||
|---|---|---|---|---|---|---|
| Mean | SD | Mean | SD | |||
| LNP-NA-RNP | 12.57 | 2.08 | 9.96 | 1.94 | -2.61 | 0.001* |
| LPF-NA-RPF | 23.85 | 2.59 | 24.92 | 1.99 | +1.07 | 0.790 |
| LNP-BA-RNP | 7.00 | 1.22 | 5.68 | 1.16 | -1.32 | 0.001* |
| RPF-NA-RNP | 33.20 | 4.04 | 37.02 | 2.88 | +3.82 | 0.001* |
| LPF-NA-LNP | 32.83 | 3.74 | 36.01 | 2.83 | +3.18 | 0.001* |
| LPF-BA-RPF | 34.45 | 4.02 | 36.10 | 5.77 | +1.65 | 0.202 |
AT indicates After Treatment group and NC Normal Control group.Mean difference = NC-AT. * Statistically significant.
DISCUSSION
The objectives of this study were to accomplish a three- dimensional volumetric, linear, and angular evaluation of the NMC in subjects presenting a posterior crossbite compared to NCs and evaluate the possibility of normalization of the nasomaxillary structures after RME compared to NCs.
Comparison of before treatment group (BT) and NC group
Volumetric variables
The literature search did not provide any article related to this topic. The results of this study demonstrated no significant difference for the volumetric variables A, B, and C between BT and NC groups. A logical explanation could be based on the conclusions from Bassil-Nassif et al.[9] advocating the existence of a compensatory mechanism among different facial dimension. Thereby, a deficiency of the transverse dimension could be equilibrated by an excess in the vertical and/or the sagittal dimension which leads to maintaining constant the total nasomaxillary volume studied.
The slight increase of the absolute values in the BT group could witness of the individual variability of subjects chosen in each group.
Linear and angular variables
Snodell et al.[1] noticed that the growth continues, for all skeletal measurements except maxillary width, in males beyond 18 years old and it stops at 17 years old in females. A difference between both genders at age 18 was found for all variables except nasal width and intermolar mandibular distance. Bayome et al.[15] did not found any difference in the maxillary basal curvature between males and females. Males presented larger facial dimensions while females demonstrated a more important gonial angle.
The decrease of the majority of the values of the linear transverse variables in the BT group compared to the NC group confirms the presence of a maxillary deficiency in the basal and dentoalveolar transverse development. These findings are supported by the significant increase of the values of the angular variables in the NC group. They are in agreement with the results of Huertas and Ghafari[5] who concluded that the majority of treated children by RME presented narrower dentoalveolar and skeletal widths than normal children.
Due to the fact that, the BT group presented linear vertical values higher than those of the NC group, we can join the same rationale of the possibility of compensation of the transverse dimension by an excess of the vertical dimension, which explains further the volumetric concordance between both groups.[9]
Cortella et al.[2] questioned the theory that transverse dimension growth is the first to be terminated by the fact that maxillary and mandibular width increase varies as sagittal and vertical growth according to gender and chronological age. The greater mandibular than the maxillary transverse growth suggests the existence of a dentoalveolar compensatory mechanism, which permits the preservation of a normal transverse posterior occlusion.[16]
Comparison of AT group and NC group
Volumetric variables
The significant increase of all the values of volumetric variables A, B, and C in the AT group compared to the NC group testifies of the overcorrection of the transverse dimension deficiency accomplished during RME where a contact between the palatal cusps of upper molars and the buccal cusps of lower molars is obtained.
Linear and angular variables
The increase of the dental and skeletal vertical posterior linear variables in the AT group compared to the NC group demonstrates that RME produced a descent of the posterior palatal region. However, the anterior palatal region presented an increase of the dental and skeletal transverse variables. Gohl et al.[11] have found closer values of intercanine and intermolar widths between the treated group by RME and untreated controls.
Kartalian et al.[12] remarked that the patients having a uni- or bilateral crossbite demonstrated a maxillary basal deficiency of 3.75 mm and the alveolar segments presented acute angles by 8.5° compared to a matched control group. AT, maxillary base width and alveolar angulations became closer to those of the control group while the transverse dental dimension was larger by 2.5 mm which is in concordance with our results where we obtained mainly a significant increase of the anterior region variables of the maxillary base (RNP-LNP) and the dentoalveolar arch (RIC-LIC et RIA et LIA).
In our study, we compared CTs to CBCTs images which are both 1:1 accurate and undistorted.
When comparing the accuracy of 3D reconstructions between CT and CBCT, Liang et al.[17] have found that the difference between the mean deviations of the measurements was from 0.1 to 0.2 mm and that the anatomical landmarks are reliably reproduced. Similarly, when comparing the accuracy of CT and CBCT to real anatomical measurements, Abboud et al.[18] concluded that the average absolute error was 0.03 mm for CT and 0.22 mm for CBCT.
The mean differences found in our study are numerically superior to the mean deviations shown in the studies above. This suggests that our method could be applied without affecting the general trend observed.
CONCLUSION
We can conclude, within the limitations of this study, that:
The volumetric absolute values of the NMC entities were higher in the treated group than in controls. The difference was statistically high significant between both groups
The volumetric increase of the NMC following RME might compensate a possible relapse and could maintain normal volumetric values.
Declaration of patient consent
Patient’s consent not required as patients identity is not disclosed or compromised.
Financial support and sponsorship
Nil.
Conflicts of interest
There are no conflicts of interest.
References
- A longitudinal cephalometric study of transverse and vertical craniofacial growth. Am J Orthod Dentofacial Orthop. 1993;104:471-83.
- [CrossRef] [Google Scholar]
- Transverse development of the jaws: Norms for the posteroanterior cephalometric analysis. Am J Orthod Dentofacial Orthop. 1997;112:519-22.
- [CrossRef] [Google Scholar]
- Transverse skeletal and dentoalveolar changes during growth. Am J Orthod Dentofacial Orthop. 2006;130:721-31.
- [CrossRef] [PubMed] [Google Scholar]
- Longitudinal posteroanterior changes in transverse and vertical craniofacial structures between 10 and 14 years of age. Angle Orthod. 2004;74:624-9.
- [Google Scholar]
- New posteroanterior cephalometric norms: A comparison with craniofacial measures of children treated with palatal expansion. Angle Orthod. 2001;71:285-92.
- [Google Scholar]
- History of imaging in orthodontics from Broadbent to cone-beam computed tomography. Am J Orthod Dentofacial Orthop. 2015;148:914-21.
- [CrossRef] [PubMed] [Google Scholar]
- Cone-beam computed tomography transverse analysis. Part I: Normative data. Am J Orthod Dentofacial Orthop. 2012;142:300-7.
- [CrossRef] [PubMed] [Google Scholar]
- Morphologic quantification of the maxilla and the mandible with cone-beam computed tomography. Am J Orthod Dentofacial Orthop. 2010;137:218-22.
- [CrossRef] [PubMed] [Google Scholar]
- Volumes faciaux et typologie verticale: Etude comparative tridimensionnelle. Orthod Fr. 2010;81:127-37.
- [CrossRef] [PubMed] [Google Scholar]
- Dimorphisme sexuel et cavités faciales: Etude volumétrique en imagerie 3D. Orthod Fr. 2011;82:217-22.
- [CrossRef] [PubMed] [Google Scholar]
- Three-dimensional computed tomography comparison of the maxillary palatal vault between patients with rapid palatal expansion and orthodontically treated controls. Am J Orthod Dentofacial Orthop. 2010;138:477-85.
- [CrossRef] [PubMed] [Google Scholar]
- Cone-beam computerized tomography evaluation of the maxillary dentoskeletal complex after rapid palatal expansion. Am J Orthod Dentofacial Orthop. 2010;138:486-92.
- [CrossRef] [PubMed] [Google Scholar]
- Three-dimensional evaluation of upper airway following rapid maxillary expansion: A CBCT study. Angle Orthod. 2014;84:265-73.
- [CrossRef] [PubMed] [Google Scholar]
- Three-dimensional changes of the naso-maxillary complex following rapid maxillary expansion. Angle Orthod. 2014;84:88-95.
- [CrossRef] [PubMed] [Google Scholar]
- New three-dimensional cephalometric analyses among adults with a skeletal Class I pattern and normal occlusion. Korean J Orthod. 2013;43:62-73.
- [CrossRef] [PubMed] [Google Scholar]
- The size of the dental arch In: The Dentition of the Growing Child. Cambridge, MA: Harvard Press; 1959. p. :87-110.
- [Google Scholar]
- A comparative evaluation of Cone Beam Computed Tomography (CBCT) and Multi-Slice CT (MSCT). Part II: On 3D model accuracy. Eur J Radiol. 2010;75:270-4.
- [CrossRef] [PubMed] [Google Scholar]
- Comparison of the accuracy of cone beam computed tomography and medical computed tomography: Implications for clinical diagnostics with guided surgery. Int J Oral Maxillofac Implants. 2013;28:536-42.
- [CrossRef] [PubMed] [Google Scholar]


