

Translate this page into:
What is the best soft-tissue reference plane to quantify lip change in bimaxillary protrusion cases? A retrospective cohort study
Mustafa Nasar (First author)

*Corresponding author: Donald J. Ferguson, DMD, MSD Department of Orthodontics, European University College, Dubai Healthcare City, PO Box 53382, Dubai, United Arab Emirates. fergusonloud@gmail.com
-
Received: ,
Accepted: ,
How to cite this article: Nasar M, Ferguson DJ, Liaw JJ, Makki L, Vaid NR. What is the best soft-tissue reference plane to quantify lip change in bimaxillary protrusion cases? A retrospective cohort study. APOS Trends Orthod 2020;10(3):178-84.
Abstract
Objectives:
The objective of the study was to evaluate the validity of five soft-tissue profile planes to actual horizontal lower lip changes following treatment of severe bimaxillary protrusion patients with vertical maxillary excess using extra-alveolar miniscrews. The null hypothesis was no differences in the incremental changes of horizontal lower lip changes from pre-treatment to post-treatment of the five methods compared to actual changes.
Materials and Methods:
Seventy adults were treated orthodontically with extractions for bimaxillary protrusion and “gummy” smile using extra-alveolar miniscrews. Lower lip horizontal position was assessed with pre- and post-treatment lateral cephalograms and five commonly used soft-tissue reference lines were used to measure horizontal lower lip treatment change.
Results:
Compared to actual therapeutic lower lip horizontal retraction (4.38 mm), soft-tissue references Ricketts’ E-line (3.89 mm) and Steiner’s S-line (3.88 mm) demonstrated no statistical difference (P > 0.05) from actual change. The five profile plane measures showed moderately high to high intercorrelations among themselves, but none of them were related to the actual amount of anteroposterior lip change that occurred. None of the five soft-tissue measurements showed a statistically significant difference (P > 0.05) between subgroups with least and greatest lower lip retraction.
Conclusion:
Under conditions of maximum lower lip retraction, Rickett’s E-line and Steiner’s S-line were fair measures of horizontal lower lip change. Although actual lower lip change and soft-tissue reference plane changes were correlated poorly, intercorrelations among the five soft-tissue references planes were moderately high. None of the five soft-tissue measurements was able to discriminate (P > 0.05) between treatments with least and greatest lower lip retraction. It may be concluded that Rickett’s E-line and Steiner’s S-line soft-tissue profile references are valid when there is considerable therapeutic retraction (4+ mm) of the lower lip.
Keywords
Orthodontic
Cephalometrics
Soft-tissue profile
Reference planes
Lower lip retraction

INTRODUCTION
Facial appearance has a major psychosocial effect on social acceptance and perceived success in society. The soft-tissue profile plays a significant role in orthodontic treatment planning; the soft-tissue profile dictates how patient treatment will be managed as the goal in treatment is to maintain or enhance facial esthetics. Facial attractiveness is determined to a great extent on the lips-nose-chin relationship and is a key feature of soft-tissue profile analyses.[1]
Bowman and Johnston analyzed 120 Class I and II orthodontic Caucasian patients, 50 were treated non- extraction and 70 were treated with various combinations of premolar extraction. The authors concluded that extraction treatment had an esthetic effect that was proportional to the patient’s pre-treatment lip procumbency (lower lip to E-plane). In contrast, non-extraction treatment had little effect on facial esthetics regardless of initial profile protrusion.[2]
Lip posture is intimately associated with orthodontic esthetics goals, and lip posture can be significantly altered in orthodontic treatment,[3-6] especially in the treatment of bimaxillary protrusive malocclusions using miniscrews.[7] Others argue that extraction has little or equivocal impact on the soft-tissue profile,[8] especially in Class I malocclusion.[9]
A variety of factors influencing soft-tissue profile changes have been identified, and it has been reported that horizontal treatment changes in the lower lip were more predictable than in the upper lip.[10,11]
The validity of five soft-tissue profile planes commonly used to describe the horizontal changes of the lower lip during orthodontic treatment which was tested by Buschang et al.[12] The study sample of 79 orthodontically treated early adolescent patients was predominately White (92.4%), mostly Class I (77.2%) with 55.7% non-extraction compared to 44.3% premolar extraction treatments. All five soft-tissue profile reference lines were constructed tangent to the soft- tissue chin (pogonion); the second cephalometric point used was nose tip,[13] midpoint of nose columella,[14] subnasale,[15] soft-tissue nasion,[16] and maxillary anterior lip tip.[17,18] The authors concluded that the reference planes did not reflect the magnitude of lower lip change, none of them were related to the actual amount of anteroposterior lip change that occurred and that soft-tissue adolescent growth must have contributed to these results.[12]
The purpose of this study was to evaluate the validity of five soft-tissue profile planes to actual horizontal lower lip changes following treatment of severe bimaxillary protrusion patients with VME using extra-alveolar miniscrews. The null hypothesis was no difference between actual horizontal lower lip treatment changes compared to five soft-tissue reference planes commonly used for soft-tissue profile treatment analysis.
MATERIALS AND METHODS
Sample
Approval was granted by the Institutional Review Board of European University College for this retrospective study of patient clinical records.
The subjects in this retrospective study included a sample of 70 Asian adults (61 females and 9 males) treated orthodontically for vertical maxillary excess, bimaxillary protrusion, and “gummy” smile from 2012 to 2016.[7] The patients were Taiwanese and treated by the same orthodontist (Dr. Johnny Liaw) using extraction therapy. The mean age of the patients was 24.1 years ages and ranged from 16 to 39 years at pre-treatment.
The patient subjects were diagnosed as Angle Class I or II bimaxillary protrusion malocclusion with vertical maxillary excess. Criteria for patient subject selection were as follows: (1) Age >16 years old, (2) gummy smile, (3) increased mandibular plan angle and lower facial height, (4) protrusive lip profile and lip incompetence, (5) mentalis muscle strain, and (6) retruded chin. Patients with syndromes, temporomandibular, and/or musculoskeletal disorders were excluded from the study.
All patients were treated orthodontically with extraction therapy; 0.018” slot mini-Wick Alexander fixed orthodontic appliances were placed in both dental arches and standardized wire sequencing was used. Extra-alveolar maxillary anterior and posterior miniscrews were placed for all patients; mandibular extra-alveolar miniscrew anchorage was used in 80% of patients in the posterior, anterior, or combination. Bio-ray A1-C type miniscrews (Bio-ray Biotech Instrument Company, Taiwan) were used with 2 mm diameter. Miniscrew length was 12 mm in maxillary posterior and 10 mm in all other locations.
Procedures
Lateral cephalograms were taken by a single orthodontist using the same cephalostat. Pre-treatment and post- treatment standardized cephalograms were secured for each patient using a Planmeca 2002 EC Proline X-ray machine. Before making the cephalometric measurements on pre- treatment and post-treatment lateral cephalograms, the pre- and post-image pairs were normalized using the cephalostat scale.
Nine cephalometric landmarks were used in the study [Table 1]. The soft-tissue profile of each cephalometric image was measured using five soft-tissue planes, as described by Buschang et al.[12] All five soft-tissue profile reference lines were constructed tangent to the soft-tissue chin (pogonion); the second cephalometric point used was nose tip,[13] midpoint of nose columella,[14] subnasale,[15] soft-tissue nasion,[16] and maxillary anterior lip tip.[17,18] In addition, the actual horizontal change of the lower lip tip that occurred during treatment was measured from the sella to the labrale inferiorus parallel to SN-7o[12] [Figure 1].
| Landmark | Description |
|---|---|
| Sella | Midpoint of the cavity of sella turcica |
| Nasion | Anterior point of the intersection between the nasal and frontal bones |
| Soft-tissue pogonion | Most prominent point on the soft-tissue contour of the chin |
| Labrale inferiorus | Most anterior portion on the margin of the lower lip |
| Labrale superioris | Most anterior portion on the margin of the upper lip |
| Subnasale | Point where lower border of the nose meets outer contour of the upper lip |
| Columella | Fleshy lower margin (termination) of the nasal septum |
| Pronasale | Most anterior point of the nose |
| Soft-tissue nasion | Point of deepest concavity of the soft-tissue contour of the root of the nose |

- Actual change in lower lip horizontal position was measured from sella to the labrale inferiorus parallel to line SN-7o (left line drawing). For each patient, five different soft-tissue reference lines were measured including the following: Rickett’s E-line, Steiner’s S1-line, Burstone’s B-line, Sushner’s S2-line, and Holdaway’s H-line.
The cephalometric radiograph analyses were performed at 200% magnification using ImageJ software, a Java-based, public domain image processing program (NIH, Bethesda, MA, USA).[19] Linear measurements using ImageJ measurement technique have been shown to be reliable and valid.[20] The cephalometric hard tissue landmarks sella and nasion and the soft-tissue landmarks pogonion, labrale inferiorus, labrale superioris, subnasale, columella, pronasale, and nasion were digitized by one of the coinvestigators on both the pre- and post-treatment cephalograms. Lower lip changes that occurred during treatment were the shortest distance from each of the five reference planes to the labrale inferiorus.
The lower lip measurement was considered positive when the lip was located anterior to the soft-tissue reference plane and negative when it was located posterior to the reference plane. The changes in this distance between pre- and post- treatment periods were calculated; the change was positive if the labrale inferiorus moved anteriorly and negative if it moved posteriorly.[12]
The actual horizontal change of the labrale inferiorus that occurred during treatment was measured from the sella to the labrale inferiorus parallel to SN-7°. If the labrale inferiorus moved anteriorly, the change was deemed positive and negative if it moved posteriorly.
Distributions of data within samples were evaluated using the Shapiro–Wilk test for same samples and distribution of data between samples was compared using Levene’s test; data distribution normality was observed within and between groups (P > 0.05). Treatment changes overtime were evaluated using paired t-tests. The actual changes in lip position and changes estimated from the profile planes were compared using paired t-tests. A significance level of 0.05 was used for all of the statistical tests.
RESULTS
The actual change in lower lip position relative to SN-7o was −4.38 ± 2.75 mm in the posterior direction (retraction) for the entire sample (n = 70). Consistent with the actual changes, the lower lip also moved posteriorly (retracted) relative to all five soft-tissue profile reference lines (E-line, S1-line, B-line, S2-line, and H-line), that is, the lower lip became more retrusive as a consequence of the treatment received but the change increment for all soft-tissue reference lines was less than the actual horizontal movement [Table 2].
| Pre-treatment | Post-treatment | Change | ||||
|---|---|---|---|---|---|---|
| Mean | SD | Mean | SD | Mean | SD | |
| Horizontal movement (mm) of labrale inferius | 76.82 | 7.13 | 72.44 | 7.44 | −4.38 | 2.75 |
| E-line | 5.71 | 2.50 | 1.82 | 1.46 | −3.89 | 2.06 |
| S1-line | 7.19 | 2.24 | 3.31 | 1.49 | −3.88 | 1.94 |
| B-line | 8.38 | 2.14 | 4.7 | 1.36 | −3.63 | 1.86 |
| S2-line | 10.93 | 3.14 | 7.47 | 1.70 | −3.46 | 2.29 |
| H-line | 4.93 | 1.84 | 1.96 | 1.17 | −2.96 | 1.49 |
SD: Standard deviations
The measurement of lower lip position to E-line demonstrated the greatest change of −3.89 ± 2.05 mm, and measurement lower lip to H-line demonstrated the least change −2.96 ± 1.49 mm. Among the five soft-tissue reference lines, the S2- line showed the largest variances with a pre-treatment, post- treatment, and change standard deviations of 3.14, 1.70, and 2.29 mm, respectively; measurements to the H-line showed the smallest variances of 1.84, 1.17, and 1.49, respectively [Table 2].
Pre-treatment to post-treatment change increments relative to each of the five soft-tissue reference lines were compared to the actual amount of lower lip change (sella perpendicular to SN-7o). Paired t-tests resulted in statistically significant differences (P < 0.05) between actual horizontal change and soft-tissue reference line change for B-line, S2-line, and H-line. There was a statistically significant correlation between actual horizontal lower lip change and lower lip to E-line change (P = 0.023), but the correlation value (r = 0.27) was so low as to be meaningless for the purpose of prediction [Tables 3 and Figure 2].
| Differences in lower lip changes | Paired t-tests | Correlations | |||
|---|---|---|---|---|---|
| Mean | SD | P sig. | r value | P sig. | |
| E line – Actual | −0.49 | 2.95 | NS | 0.27 | 0.023 |
| S1 line – Actual | −0.50 | 3.03 | NS | 0.20 | NS |
| B line – Actual | −0.75 | 3.02 | 0.041 | 0.18 | NS |
| S2 line – Actual | −0.92 | 3.53 | 0.032 | 0.03 | NS |
| H line – Actual | −1.42 | 2.87 | 0.000 | 0.19 | NS |

- Lower lip horizontal retraction changes represented by actual and soft-tissue reference lines E, S1, B, S2, and H. Note that all reference line change increments were smaller than actual change for the total sample (n = 70). The red asterisk indicates statistical differences (P < 0.05) between B, S2, and H line and actual horizontal lip change.
The sample of 70 patients was divided equally (n = 35) based on amount of actual lower lip change; the actual change was compared to pre- to post-treatment change increment per soft-tissue reference line using paired t-tests. In the subsample with the least retraction, all actual versus reference line comparisons were statistically significant except H-line which differed from actual change by only 0.68 mm (P = 0.062). In the subsample representing the greatest lower lip retraction, the mean actual change increment was significantly higher than reference line changes with mean differences ranging from 2.31 to 3.52 mm [Figure 3].
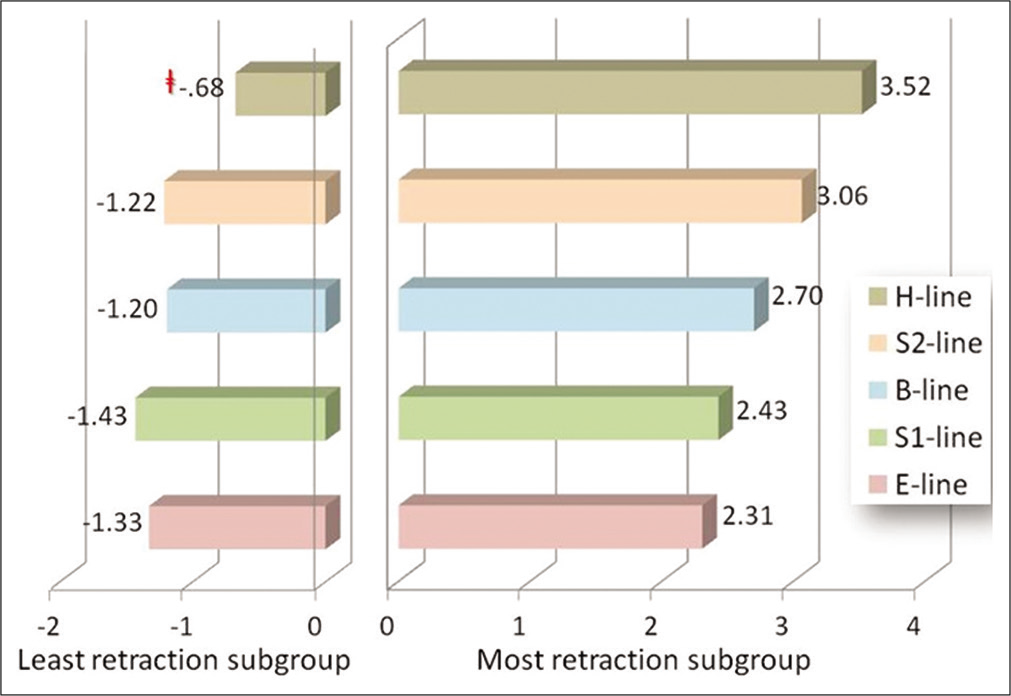
- The sample was divided equally by actual lower lip change into most and least retracted subgroups (n = 35 each). Paired t-tests demonstrated significant differences (P < 0.05) between changes in actual and soft-tissue reference lines except in the least retraction subgroup, that is, H-line (−0.68 mm) change was not different (P > 0.05) than actual change as signified by the symbol. Note that soft-tissue reference line changes were generally more representative of actual lower lip change when lower lip was retracted the least.
Lower lip change increment per soft-tissue reference plane was compared between least and greatest lower lip retraction subgroups using independent t-tests. No significant differences (P > 0.05) were observed using any of the five reference lines (not shown).
The horizontal lip changes measured relative to the five soft- tissue reference planes showed mostly moderately high to moderate (r = 0.85–0.72) correlation except the correlation was high (r = 0.96) between S1-line and B-line and low (r = 0.53) between S2-line and H-line. Correlations between actual lip change to SN-7o and soft-tissue reference planes were low (r = 0.27–0.03) [Figure 4].
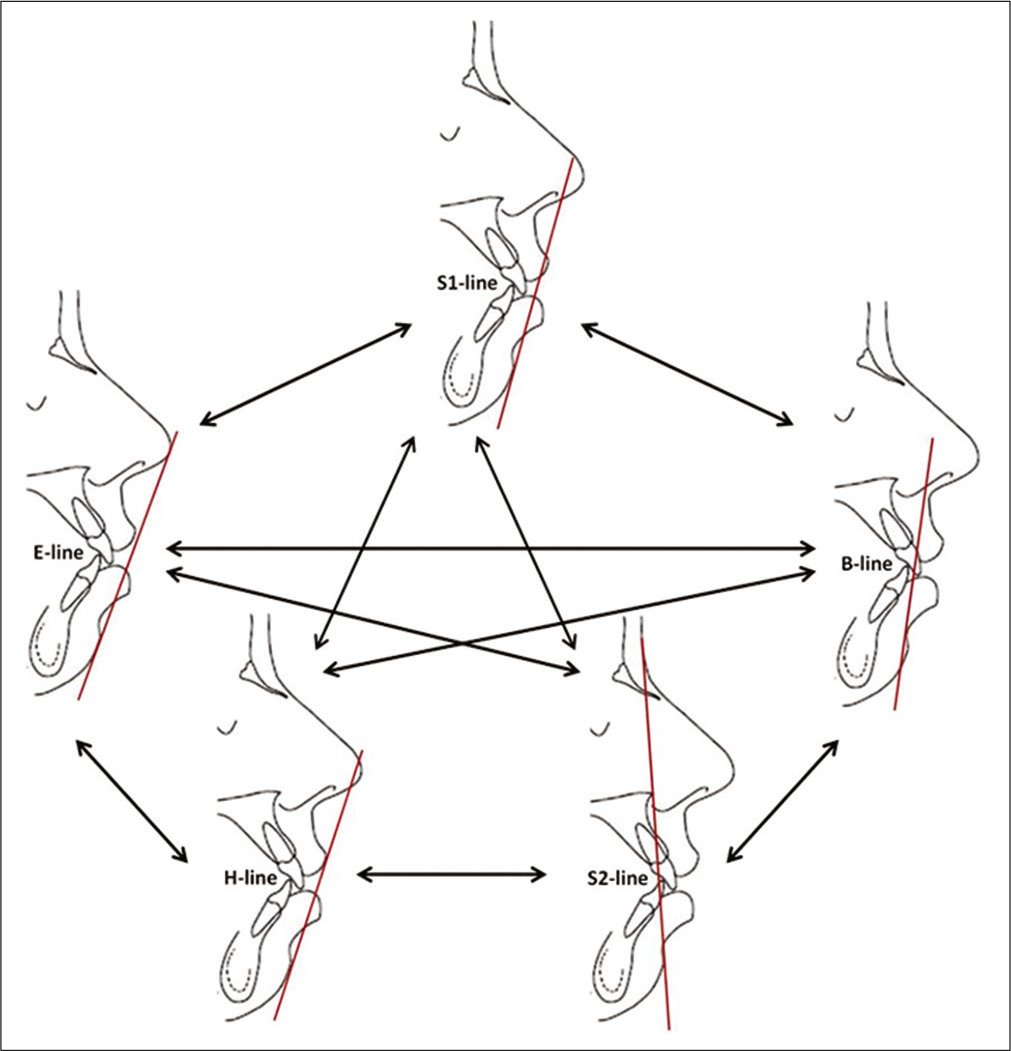
- Pearson’s correlation coefficients for horizontal lower lip change among the five soft-tissue reference planes were mostly moderately high. Correlations between actual lip change to SN-7o and soft-tissue reference planes were low (in bold parentheses).
DISCUSSION
The study sample of 70 Taiwanese patients represented bimaxillary protrusive malocclusions treated by premolar extraction using extra-alveolar miniscrew anchorage in the maxilla of all patients and in the mandible of some patients. The lower lip was retracted an average of −4.38 ± 2.75 mm. Paired t-tests between actual lower lip horizontal change and lower lip change to soft-tissue reference lines demonstrated similar changes (P > 0.05) in lower lip to E-line (−3.89 ± 2.06 mm) and to S1-line (−3.88 ± 1.94 mm). In other words, Rickett’s E-line and Steiner’s S1-line were a fair and valid measure of horizontal lower lip change under conditions of maximum lower lip retraction; the null hypothesis is accepted for E-line and S1-line.
No other investigation has compared actual lower lip treatment change to any soft-tissue reference plane(s) in bimaxillary protrusive patients with vertical maxillary excess orthodontically treated with premolar extractions and using miniscrew anchorage. Buschang et al.[12] used the same methodology as the present study in a sample of 35 patients treated with premolar extraction, and the actual lower lip position became more protrusive by 1.58 ± 3.98 mm. In the present study, actual lower lip retraction during treatment was −4.38 ± 2.75 mm, a difference of 5.96 mm.
When subsamples (n = 35) of high and low lower lip retraction were tested in the present study by soft-tissue reference lines against actual lower lip change, results of the total sample analysis did not hold. In the subgroup with the least amount of actual lower lip retraction, H-line treatment change (−2.91 ± 1.61 mm) was statistically similar to actual lower lip retraction change (−2.23 ± 1.61 mm) and differed by only 0.68 mm (P > 0.05). In the subsample with the greatest amount of actual (−6.54 ± 1.78 mm) lower lip retraction, all of the five soft-tissue reference line changes were statistically different (P < 0.05).
The two subgroups of least and greatest lower lip retraction (n = 35) were t-tested by soft-tissue reference line; differences ranged from 0.03 to 0.67 mm and no significant differences (P > 0.05) were observed. In other words, none of the soft- tissue reference lines discriminated between least and greatest lip retraction subgroups.
Correlations between actual and soft-tissue reference line changes ranged from r = 0.27 to .03 and were not closely related to the actual lip changes. The correlations showed that the profile planes explained only 0.09% (S2-line) to 7.3% (E-line) of the variation in the actual lip changes that occurred. In contrast, the lip changes measured by the five reference planes showed moderately high to high intercorrelations. The highest correlation was between S1-line and B-line (r = 0.96) and all others were moderately high (r = 0.85–0.72) with the exception that the correlation between S2-line and H-line was only r = 0.53. Results from the Buschang et al.[12] study demonstrated similar intercorrelation trends; the lowest correlation in that study was between Sushner’s S2-line and Holdaway’s H-line (r = 0.81), and the authors speculated that the reason was landmarks that are widely separated and have little in common between the two soft-tissue reference lines. From the perspective of the present study, also contributing to this low correlation is that the H-line upper lip tip landmark does not necessarily remain stationary during treatment unlike soft-tissue nasion.
With the exception of the Holdaway H-Line, the soft- tissue profile measurements showed significant differences compared to actual lower lip changes in the highest and lowest actual lip retraction subgroups. The clinical implication is that the Holdaway H-line may be a good indicator of lower lip change in extraction therapy when the lower lip is retracted the least.
Buschang et al.[12] concluded that the reference planes did not reflect the magnitude of the lower lip change nor the direction of change. In the present study of maximum lower lip retraction, mean Rickett’s E-line and Steiner’s S1- line measurements were statistically the same (P > 0.05) as actual of horizontal lower lip change in both magnitude and direction of change. Buschang et al.[12] concluded that the five reference planes should not be used to measure the changes in lower lip position that occurs during orthodontic treatment. It is the conclusion of the present study that the use of E-line and S-line soft-tissue profile reference planes appears valid under conditions of maximum therapeutic retraction of the lower lip.
There are a number of confounding factors that may have influenced the study results: (1) Animation of the lips during cephalometric imaging is difficult to control; slight animation of the lips may have affected lip position and measurements. (2) The sample mean age was 24.1 years and the youngest patient was 16 years; although growth changes in the present study were likely insignificant overall, the influence of growth on treatment outcomes cannot be ruled out. (3) The sample was predominately female (87.1%) and a fair comparison by gender was not feasible; it is difficult to generalize the results with a gender ratio imbalance. (4) The sample was Asian (Taiwanese) and, again, it is difficult to generalize the results based on a single ethnic group. (4) Any retrospective study has inherent biases associated with sampling that can influence results, but sample selection bias is a mute issue for a validity study.
CONCLUSION
Study results in a sample of 70 bimaxillary protrusion malocclusion patients with vertical maxillary excess treated using extraction therapy and extra-alveolar miniscrew anchorage were as follows:
The soft-tissue reference planes Rickett’s E-line and Steiner’s S-line were fair measures of horizontal lip change; the null hypothesis is accepted for these two soft-tissue reference lines.
None of the five profile plane measures were correlated to the actual amount of anteroposterior lip change that occurred, but the five soft-tissue measurements were moderately high to highly intercorrelated.
None of the five soft-tissue measurements was able to discriminate (P > 0.05) between treatments with least and greatest lower lip retraction.
In conclusion and based on the conditions of the study, the use of Rickett’s E-line and Steiner’s S-line soft- tissue profile reference planes are valid when there is considerable therapeutic retraction (4+ mm) of the lower lip.
Declaration of patient consent
Institutional Review Board (IRB) permission obtained for the study.
Financial support and sponsorship
Nil.
Conflicts of interest
Dr. Nikhilesh R. Vaid is the Editor-In-Chief of this Journal.
References
- Psychosocial impact of dental esthetics on quality of life in adolescents. Angle Orthod. 2009;79:1188-93.
- [CrossRef] [PubMed] [Google Scholar]
- The esthetic impact of extraction and nonextraction treatments on Caucasian patients. Angle Orthod. 2000;70:3-10.
- [Google Scholar]
- Changes in soft tissue profile after orthodontic treatment with and without extraction: Systematic review and meta-analysis. J Evid Base Dent Pract. 2018;18:193-202.
- [CrossRef] [PubMed] [Google Scholar]
- Soft-tissue changes in Class II malocclusion patients treated with extractions: A systematic review. Eur J Orthod. 2019;38:631-7.
- [CrossRef] [PubMed] [Google Scholar]
- Changes in soft tissue profile after orthodontic treatment with and without extractions. Am J Orthod Dentofacial Orthop. 2002;122:67-72.
- [CrossRef] [PubMed] [Google Scholar]
- Skeletal and soft tissue Point A and B changes following orthodontic treatment of Nepalese Class I bimaxillary protrusive patients. Angle Orthod. 2010;80:91-6.
- [CrossRef] [PubMed] [Google Scholar]
- Treatment of VME using extra alveolar TADs-quantification of treatment effects. Semin Orthod. 2018;24:123-34.
- [CrossRef] [Google Scholar]
- Soft tissue changes following extraction vs. Nonextraction orthodontic fixed appliance treatment: A systematic review and meta-analysis. Eur J Oral Sci. 2018;126:167-79.
- [CrossRef] [PubMed] [Google Scholar]
- Soft tissue facial profile changes after orthodontic treatment with or without tooth extractions in Class I malocclusion patients: A comparative study. J Oral Biol Craniofac Res. 2019;9:172-6.
- [CrossRef] [PubMed] [Google Scholar]
- Factors influencing soft tissue profile changes following orthodontic treatment in patients with Class II Division 1 malocclusion. Progr Orthod. 2016;17:1-8.
- [CrossRef] [PubMed] [Google Scholar]
- Lip curve changes in females with premolar extraction or nonextraction treatment. Angle Orthod. 2004;74:51-62.
- [Google Scholar]
- Can commonly used profile planes be used to evaluate changes in lower lip position? Angle Orthod. 2011;81:557-63.
- [CrossRef] [PubMed] [Google Scholar]
- Esthetics, environment, and the law of lip relation. Am J Orthod. 1968;54:272-289.
- [CrossRef] [Google Scholar]
- Lip posture and its significance in treatment planning. Am J Orthod. 1967;53:262-84.
- [CrossRef] [Google Scholar]
- A photographic study of the Negro population. Am J Orthod. 1977;72:373-85.
- [CrossRef] [Google Scholar]
- A soft-tissue cephalometric analysis and its use in orthodontic treatment planning. Part I. Am J Orthod. 1983;84:1-28.
- [CrossRef] [Google Scholar]
- Changes in relationship of points A and B during orthodontic treatment. Am J Orthod. 1956;42:176-93.
- [CrossRef] [Google Scholar]
- Root coverage assessment: Validity and reproducibility of an image analysis system. Clin Periodontol. 2007;34:969-76.
- [CrossRef] [PubMed] [Google Scholar]


