

Translate this page into:
Three-dimensional assessment of condylar morphology, position, and joint spaces in different jaw base divergences: A cone-beam computed tomography study

-
Received: ,
Accepted: ,
How to cite this article: Patil S, Basavaraddi SM, Revankar AV, Naik RD, Naik B. Three dimensional assessment of condylar morphology, position, and joint spaces in different jaw base divergences: A cone-beam computed tomography study. APOS Trends Orthod. doi: 10.25259/APOS_271_2023
Abstract
Objectives:
The mandibular condyle being part of the temporomandibular joint complex, its volume, and shape play a pivotal role in treatment stability and outcomes in orthodontic and orthognathic patients over the long term. Different loading patterns would result in different morphology of the TMJ. The association with different facial types and understanding of the relationship between condylar morphology and jaw base divergence is limited. The objective of this study was to assess the condylar morphology, which includes condylar height, length, width, axis angulation, joint spaces, height of the fossa, and volume in different jaw base divergences.
Material and Methods:
A cross-sectional study was conducted in which 90 patients undergoing orthodontic treatment were selected and allocated into three groups of 30 each, namely, hypodivergent, normodivergent, and hyperdivergent based on Frankfort mandibular plane angle. Patients satisfying the inclusion criteria were subjected to lateral cephalogram and cone-beam computed tomography under standard resolution and field of view of 8 × 8 cm2 with the teeth in maximum intercuspation. On the obtained digital imaging and communications in medicine image, ten anatomical landmarks were marked and analyzed using Carestream imaging software. The condylar volume was assessed using three-dimensional Slicer software. Results were statistically analysed using analysis of variance and post hoc Bonferroni test.
Results:
The average values of the condylar width and volume showed statistically significant values in the hypodivergent whereas axis angulation and superior joint spaces in the hyperdivergent groups, respectively.
Conclusion:
Hypodivergent individuals have condyles that are larger in size and volume, whereas hyperdivergent individuals have larger axis angulation and more superiorly positioned condyles.
Keywords
Cone-beam computed tomography
Condylar height
Width
Length
Axis angulation
Condylar volume

INTRODUCTION
Mandibular condyle, being a part of the temporomandibular joint (TMJ), its volume and position have been proposed to play a significant role in maintaining or restoring TMJ harmony with the dentition and is crucial for obtaining a stable occlusion following orthodontic treatment.[1,2] Consequently, in addition to addressing occlusal interferences and tooth alignment issues, orthodontists should also establish condylar positions that are harmonious with the dentition.[3] Because each person has a unique craniofacial morphology, condyle, and fossa load differently in each individual, resulting in unique TMJ morphology. The skeletal pattern is known to have a significant impact on the diagnosis, treatment planning, and prognosis of orthodontic treatment. Occlusal force characteristics and masticatory muscle activity are both influenced by jaw base divergence and anteroposterior skeletal relationship.
The temporal bone, articular disk, and mandibular condyle make up the intricate anatomy of the TMJ. Furthermore, there are bony structures all around the TMJ, making it difficult to visualize the TMJ with conventional two-dimensional (2D) radiography.[4] The three-dimensional (3D) mandibular condyle morphology cannot be adequately examined using 2D imaging techniques like panoramic radiography.[5,6]
Magnetic resonance imaging and computed tomography (CT) have been recommended earlier for 3D examination of the TMJ.[7,8] Cone-beam CT (CBCT) can get around some of the drawbacks of conventional CT, namely, its high price, equipment accessibility issues, and relatively high exposure to radiation. Through the use of tomograms, associations between the condylar position and sagittal skeletal pattern have been established in various studies.[9]
Park et al.[3] conducted a CBCT-based comparison of condylar position and morphology, and joint spaces according to the vertical skeletal pattern of the Korean population and concluded that the condylar position varies according to the vertical facial types. Sauccani et al.[10] conducted a study on Caucasian adults to know the correlation between condylar volume and different mandibular divergences and concluded that hyodivergent individuals have greater condylar volume than hyperdivergent and normodivergent individuals. Burke et al.[11] conducted a study on the Canadian population to study the correlations between condylar characteristics and facial morphology in Class II preadolescent patients and concluded that patients with vertical facial morphologic characteristics displayed decreased superior joint spaces and posteriorly angled condyles. Increased superior joint spaces and anteriorly angled condyles were significantly correlated to patients with a horizontal facial morphology. No significant correlations between the other condylar characteristics and facial morphology were determined. However, understanding the relationship between condylar position, morphology, volume, joint spaces, and vertical skeletal pattern is limited for the Indian population. Hence, the objective of the study is to assess the condylar morphology, that is, condylar height, length and width, volume, height of the mandibular fossa, joint spaces, and axis angulation in different jaw base divergences, namely, hypodivergent, normodivergent, and hyperdivergent using CBCT in South Indian population.
MATERIAL AND METHODS
Sample selection
This study was approved by the Institutional Review Board of Shri Dharmasthala Manjunatheshwara College of Dental Sciences and Hospital, Dharwad, India (IRB Approval no: SDMCDS IEC. No. 2021/P/OR/73).
Patients of South Indian origin reporting for orthodontic needs were selected for the study following informed consent. Purposive sampling with a total of 90 subjects were included in the study with a skeletal Class I malocclusion (ANB angle of 2–4°). The subjects were divided into three groups comprising 30 patients each in the hypodivergent, normodivergent, and hyperdivergent groups.
Inclusion criteria
The following criteria were included in the study:
Age: 18–30 years
Patients with skeletal Class I malocclusion
Patients with no previous history of orthodontic or orthopedic treatment
Patients with fully erupted permanent dentition, excluding third molars.
Exclusion criteria
The following criteria were excluded from the study
Patients having any systemic/congenital diseases.
Individuals who have experienced craniofacial trauma, TMJ disorders, or deformities in the past
Patients with malignancy or any other systemic diseases
Patients with any condition or syndrome affecting bone metabolism
Patients with any gross facial asymmetry or functional mandibular deviation due to occlusal interferences
Pregnant and lactating women.
After the inclusion and exclusion criteria were met, a total of 90 subjects were included in the study. CBCT images and lateral cephalogram were taken for all the subjects, and the evaluation of the lateral cephalogram was carried out. The subjects were assigned to one among the three groups based on Frankfort Mandibular Plane Angle (FMA), with 30 patients in each group: group 1 – normodivergent facial type (FMA = 22–25°), group 2 – hypodivergent facial type (FMA <22°), and group 3 – hyperdivergent facial type (FMA >25°).
CBCT image was taken for each subject using a Carestream CS 9600 CBCT scanner (Carestream Health, Inc, Rochester, NY, USA). The field of view (FOV) was adjusted at 8 × 8 cm2, tube voltage at 120 KV, tube current 4.0 mA with a standard image resolution, and exposure time of 15.0 s, and rotation was adjusted at 360°. Subjects were in a static posture with their Frankfort horizontal (FH) plane parallel to the floor and teeth in maximal intercuspation while a CBCT image was being taken. On the obtained digital image, the morphology of the condyle was analyzed using Carestream Imaging Software (version 8.0.25, Carestream Health, Inc, Rochester, NY, USA) and 3D Slicer Software[12] (version 5.6.1, https://www.slicer.org/).
To assess condylar size (width, length, and height), fossa height, and condyle-to-fossa joint spaces at the anterior, superior, and posterior condylar poles ten anatomic landmarks were identified for measurements, as indicated in [Figure 1]: Cd-med, Cd-lat, Cd-sup, Cd-ant, Cd-post, Siginf, Sig-post, Fs-sup, At-inf, and Am-inf.[3]

- Diagrammatic representation of condylar measurements (a) width, (b) length, (c) fossa height, (d) condylar height, (e) axis angulation, (f) joint spaces, and (g) volumetric measurement.
Stringert and Worms[15] and Burke et al.[11] developed methods for measuring the size of the condyle on both the right and left sides. The distances between the marked anatomical landmarks were calculated to determine the length, width, and height of the condyle.
The most protruding point on the lateral side of the coronal slice is marked as Cd-lat. Cd-med is the most projecting point on the medial side of the coronal slice. The condylar width was measured as the distance between the Cd-med and Cd-lat [Figures 1 and 2a]. The sagittal section was identified from the serial axial sections, and the highest point of the condyle was marked on the sagittal section.

- (a) Cone-beam computed tomography (CBCT) image showing the measurement of the condylar width. (b) CBCT image showing length of the condyle in the sagittal plane.
Cd-sup was the point identified at the most superior location of the condyle. Cd-ant was 4 mm below Cd-sup on the anterior surface of the condyle. The Cd-post was found 4 mm below the Cd-sup on the condyle’s posterior surface. Between the Cd-ant and the Cd-post, a line was established. The length of the condyle was determined by measuring this line [Figures 1 and 2b].
The baseline for measuring the height of the mandibular fossa is drawn from the lowermost point on the articular tubercle (At-inf) to the lowermost point of the auditory meatus (Am-inf), as suggested by Rodrigues et al.[13-15] A perpendicular is drawn from this line to the fossa’s superior most point. The perpendicular distance gives the height of the fossa [Figures 1 and 3].

- Cone-beam computed tomography image of condyle showing the height of the mandibular fossa in the sagittal plane.
In the sagittal view, a tangent is drawn on the posterior surface of the mandible; the condylar height can be determined by drawing the right angle to this tangent from the most caudal point of the mandibular notch (incisura mandibulae) to the most cranial point on the condyle [Figure 1 and 4]. The condylar height was determined by measuring the distance between these two perpendiculars, as explained by Kjellberg et al.[16]

- Cone-beam computed tomography image of condyle showing the height of the condyle (The tangent is drawn on the posterior border of the mandible and a perpendicular is drawn from the mandibular notch to this tangent and the perpendicular from the most superior point on the condyle).
Condylar axis angulation is the measurement of the angle formed by the long axis of the mandibular condyle and a line parallel to the FH plane in sagittal view, as suggested by Pushka et al.[17] [Figures 1 and 5].

- Cone-beam computed tomography image of condyle showing the condylar axis angulation (Angle between the long axis of the condyle and a line parallel to the Frankforts horizontal plane is measured).
The following linear measurement was made of the joint spaces between the glenoid fossa and the mandibular condyle, as suggested by Rodrigues et al.[12,13]
The true horizontal line was defined as a horizontal line that coincided with the superior most convex point of the glenoid fossa (superior fossa [SF]) [Figures 1 and 6]. The superior joint space was determined by the distance between the Cd-sup to the SF. The anterior and posterior joint spaces were determined by drawing a tangential line joining the most convex ventral and dorsal sections of the condyle to the SF and determining the locations coinciding with the anterior and posterior spaces. A perpendicular line was drawn to the tangential line to determine the distance between the glenoid fossa and the anterior and posterior condyles, which were calculated as the anterior and posterior joint spaces [Figures 1 and 6].
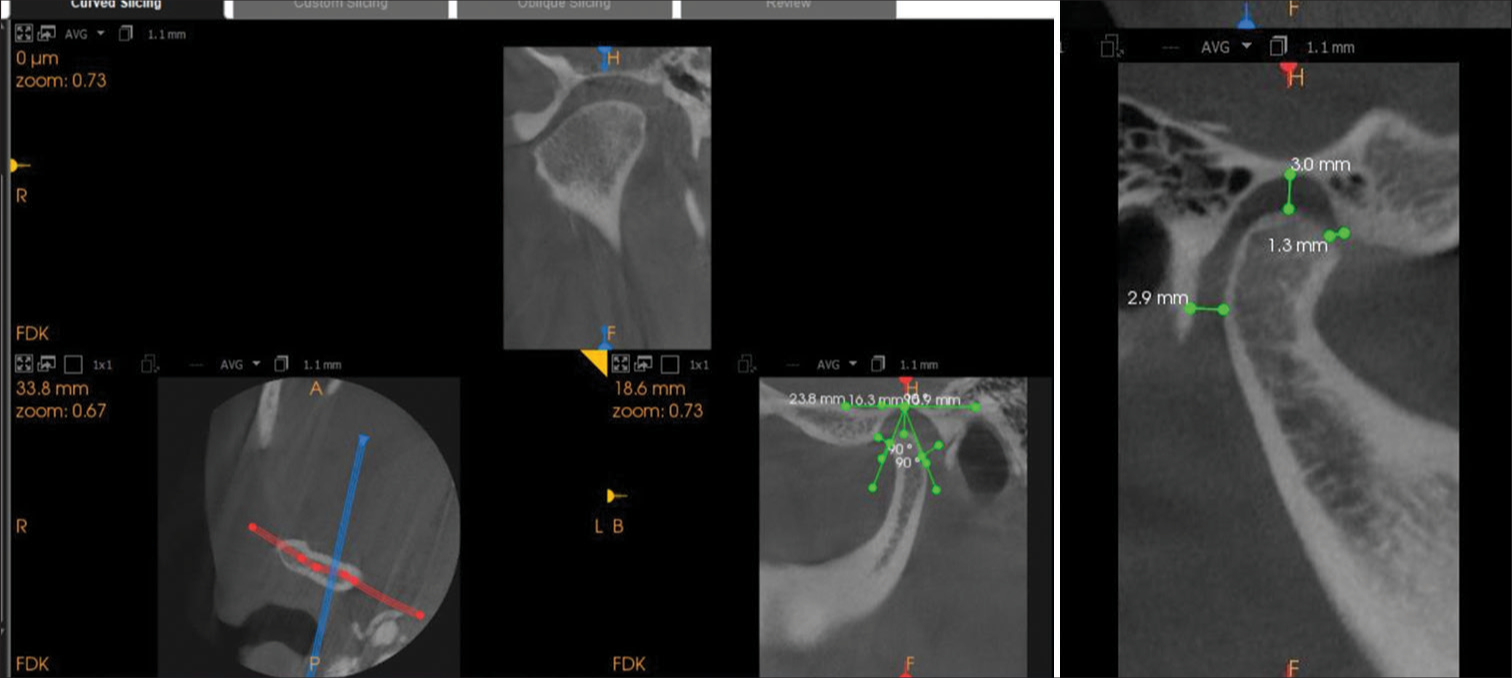
- Cone-beam computed tomography image of condyle showing the measurement of the anterior, superior, and posterior joint spaces.
Condylar volume was calculated using the 3D slicer software[10] following the procedure described below.
The mandibular condyle was segmented using 3D Slicer software, utilizing 2D digital imaging and communications in medicine images generated from a CBCT data set [Figure 7a and b]. Two imaginary lines passing through the most superior part of the condyle that is, condylion, and most caudal point, that is, sigmoid notch, were considered. Manual segmentation of the condyles was performed following the subsequent steps: A bounding box was defined, in which the limits of the anatomical structure to be segmented were marked out [Figure 7a]. The upper and lower limits of the condyle were defined [Figure 7b]. Before the 3D and volumetric measurements, each condyle was visually isolated and seen within the suggested bone density range (a grayscale spanning from −1000 to 1900 HU). To create a 3D representation of the condyle, the area surrounding the TMJ was then graphically enlarged [Figure 7c], and the remaining surrounding anatomical structures were gradually deleted [Figure 7d] from the condyle using graphical sculpting tools. For every condyle, 3D multiplanar reconstructions were created after the computer isolations were completed [Figure 7e]. Volumetric measurements were obtained using the 3D Slicer automated function for each condyle. All the measurements were done by the same operator (S.P) at 2 time points. Two weeks apart the obtained values were subjected to statistical analysis.

- Condylar volume measurement in 3D Slicer. (a) Bounding box showing area of interest. (b) Volume rendered enlarged image showing upper and lower limits. (c) Enlarged condyle is seen within the bone density range. (d) Graphical sculpting tools are used to remove the surrounding structures. (e) 3D reconstructed image of the condyle. ROI: Region of interest, CBCT: Cone-beam computed tomography.
Statistical analysis
The sample size was calculated by power analysis using G power software (version 3.0.1, IBM, USA). With an alpha error of 5% and a power of 80%, a sample size of 30 for each group was adequate to detect the differences in condylar morphology in different growth parameters. Descriptive analysis of the data was represented as means and standard deviation. The Statistical Package for the Social Sciences (version 20.0, IBM, USA was used to analyze all the data. The statistical significance of both continuous and categorical data was examined. The Shapiro–Wilk test was used to verify the continuous data’s assumption of normalcy.
A one-way analysis of variance was used to compare the mean and standard deviation both within and between groups. A 5% significance level (P ≤ 0.05) was chosen. The multiple comparisons among the three groups were calculated using the post hoc Bonferroni test to assess the significance level.
RESULTS
The intra-class correlation coefficient was performed to assess the intraoperator reliability of measurements and ranged from 0.91 to 0.99, indicating excellent reliability. Group-1: hypodivergent, Group-2: normodivergent, and Group-3: hyperdivergent. The mean age of the individuals in all the groups is 22.5 years, with the total number of individuals in each group being 30, with all female subjects.
[Table 1 and Figure 8] illustrate the condylar width among the three groups distributed at a 95% confidence interval (CI). The condylar width mean values for groups 1, 2, and 3 were 17.90 ± 4.02 mm, 13.81 ± 3.54 mm, and 15.13 ± 3.26 mm, respectively. The Bonferroni post hoc test showed that group 1 had statistically significantly higher values than groups 2 and 3 [Table 2].
| Parameters | Group | n | Mean | SD | 95% confidence interval for mean | F value | P-value | |
|---|---|---|---|---|---|---|---|---|
| Lower bound | Upper bound | |||||||
| Condylar Width (mm) | 1 | 30 | 17.90 | 4.02 | 16.40 | 19.40 | 9.840 | 0.000* |
| 2 | 29 | 13.81 | 3.54 | 12.46 | 15.16 | |||
| 3 | 31 | 15.13 | 3.26 | 13.94 | 16.33 | |||
| Total | 90 | 15.63 | 3.96 | 14.80 | 16.46 | |||
| Condylar Height (mm) | 1 | 30 | 22.23 | 6.16 | 19.93 | 24.53 | 1.671 | 0.194 |
| 2 | 29 | 21.89 | 6.99 | 19.23 | 24.54 | |||
| 3 | 31 | 24.85 | 7.50 | 22.10 | 27.60 | |||
| Total | 90 | 23.02 | 6.96 | 21.56 | 24.48 | |||
| Condylar Length (mm) | 1 | 30 | 5.67 | 1.50 | 5.11 | 6.23 | 1.624 | 0.203 |
| 2 | 29 | 6.61 | 2.96 | 5.48 | 7.73 | |||
| 3 | 31 | 6.00 | 1.27 | 5.53 | 6.46 | |||
| Total | 90 | 6.08 | 2.04 | 5.66 | 6.51 | |||
| FOSSA (mm) | 1 | 30 | 7.11 | 2.05 | 6.34 | 7.87 | 0.561 | 0.572 |
| 2 | 29 | 7.06 | 2.39 | 6.15 | 7.97 | |||
| 3 | 31 | 7.59 | 2.08 | 6.83 | 8.36 | |||
| Total | 90 | 7.26 | 2.16 | 6.81 | 7.71 | |||
| Condylar Axis (degrees) | 1 | 30 | 57.41 | 7.35 | 54.71 | 60.10 | 5.750 | 0.005* |
| 2 | 29 | 60.86 | 7.21 | 59.04 | 64.53 | |||
| 3 | 31 | 63.54 | 7.29 | 60.82 | 66.26 | |||
| Total | 90 | 63.54 | 7.66 | 59.26 | 62.47 | |||
| Anterior FOSSA (mm) | 1 | 30 | 2.03 | 0.87 | 1.70 | 2.36 | 0.024 | 0.976 |
| 2 | 29 | 2.02 | 0.67 | 1.77 | 2.27 | |||
| 3 | 31 | 1.99 | 0.90 | 1.66 | 2.32 | |||
| Total | 90 | 2.01 | 0.81 | 1.84 | 2.18 | |||
| Superior FOSSA (mm) | 1 | 30 | 4.26 | 1.02 | 3.88 | 4.64 | 9.613 | 0.000* |
| 2 | 29 | 3.07 | 1.31 | 2.57 | 3.57 | |||
| 3 | 31 | 3.09 | 1.26 | 2.63 | 3.55 | |||
| Total | 90 | 3.47 | 1.31 | 3.20 | 3.75 | |||
| Posterior FOSSA (mm) | 1 | 30 | 2.55 | 1.25 | 2.09 | 3.02 | 1.114 | 0.333 |
| 2 | 29 | 3.07 | 1.84 | 2.37 | 3.77 | |||
| 3 | 31 | 2.64 | 1.10 | 2.24 | 3.05 | |||
| Total | 90 | 2.75 | 1.43 | 2.45 | 3.05 | |||
| Condylar Volume (mm3) | 1 | 30 | 1357.94 | 351.12 | 1226.83 | 1489.05 | 3.764 | 0.027* |
| 2 | 29 | 1066.88 | 379.38 | 922.57 | 1211.19 | |||
| 3 | 31 | 1096.35 | 581.07 | 883.21 | 1309.49 | |||
| Total | 90 | 1174.05 | 465.30 | 1076.60 | 1271.51 | |||

- Means of the parameters (condylar width, length, and height) among three groups. Group 1- hypodivergent, group 2- normodivergent, and group 3- hyperdivergent.
| Dependent Variable | Mean difference | P-value | 95% confidence interval | |
|---|---|---|---|---|
| Lower bound | Upper bound | |||
| Condylar width (mm) | ||||
| 1 | ||||
| 2 | 4.08 | 0.000* | 1.78 | 6.38 |
| 3 | 2.76 | 0.011* | 0.50 | 5.03 |
| 2 | ||||
| 3 | −1.32 | 0.485 | −3.60 | 0.96 |
| Condylar axis (degrees) | ||||
| 1 | ||||
| 2 | 1.76 | 1.000 | −2.88 | 6.39 |
| 3 | −6.14 | 0.004* | 1.58 | 10.69 |
| 2 | ||||
| 3 | 4.38 | 0.067 | −0.21 | 8.97 |
| Superior FOSSA (mm) | ||||
| 1 | ||||
| 2 | 1.19 | 0.001* | 0.42 | 1.95 |
| 3 | 1.17 | 0.001* | 0.42 | 1.92 |
| 2 | ||||
| 3 | −0.02 | 1.000 | −0.78 | 0.73 |
| Condylar volume (mm3) | ||||
| 1 | ||||
| 2 | 291.06 | 0.046* | 4.04 | 578.08 |
| 3 | 261.59 | 0.079 | −20.68 | 543.86 |
| 2 | ||||
| 3 | −29.47 | 1.000 | −314.20 | 255.27 |
The mean values of the condylar axis angulation in three groups with a 95% CI of the means are shown in [Table 1]. The mean values in groups 1, 2, and 3 are 57.41 ± 7.35°, 60.86 ± 7.21°, and 63.54 ± 7.29°, respectively. According to the Bonferroni post hoc test, group 3 shows statistically significantly higher values than groups 1 and 2 [Table 2]. The same is shown in [Figure 8].
[Table 1 and Figure 9] show the illustration of condyle to joint spaces in three groups with a 95% CI of the mean. The average values for Group 1 in anterior, superior, as well as posterior joint spaces, are 2.03 ± 0.87 mm, 4.26 ± 1.02 mm, and 2.55 ± 1.25 mm, respectively.

- Means of height of mandibular fossa and joint spaces among three groups. Group 1- hypodivergent, group 2- normodivergent, and group 3- hyperdivergent. FOSSA: Height of mandibular fossa, A.FOSSA: Anterior fossa, S.FOSSA: Superior fossa, P.FOSSA: Posterior fossa
In group 2, mean values for anterior, superior, and posterior joint spaces are 2.01 ± 0.81 mm, 3.04 ± 1.31 mm, and 3.09 ± 1.26 mm, respectively. In group 3, mean values for anterior, superior, and posterior joint spaces are 1.99 ± 0.90 mm, 3.107 ± 1.31 mm, and 2.66 ± 1.10 mm, respectively. Superior joint space in group 3 shows statistically significant values according to multiple comparison tests [Table 2].
The comparison of means of the volume in the three groups is shown in [Table 1]. The average values for groups 1, 2, and 3 are 1357.94 ± 351.12 mm3, 1066.88 ± 379.38 mm3, and 1096.34 ± 581.07 mm3, distributed at a 95% CI of the mean. The multiple comparisons between the three groups show statistically significant values in group 1 compared to groups 2 and 3, as shown in [Table 2 and Figure 10]. The results can be summarised as follows;
Hypodivergent individuals have greater condylar width than normodivergent and hyperdivergent individuals
The angulation of the condylar axis was found to be greater in hyperdivergent than hypodivergent and normodivergent groups, indicating more anterior positioning of the condyle in the fossa in hyperdivergent individuals
On comparison of the condyle to joint spaces, the superior joint space was found to be greater in hypodivergent than in normodivergent and hyperdivergent individuals
Condylar volume was found to be higher in the hypodivergent group compared with the normodivergent and hyperdivergent individuals.

- Means of condylar volume among three groups. Group 1-hypodivergent, group 2- normodivergent, and group 3- hyperdivergent.
DISCUSSION
CBCT, due to its ability to produce consistently good quality 3D images with less radiation exposure, is the current gold standard for assessing orofacial structures. Traditional X-rays used in orthodontic treatment are insufficient because the condyle is a 3D structure.[18,19] CBCT generates high-resolution images with high measurement precision.[20] One of the main advantages of CBCT is its ability to produce scans with varying FOVs.[3] Therefore, direct scans from the required region can be obtained according to the clinical indication. Therefore, in this study, CBCT was used for radiographic analysis. Because the sample comprises data from patients who were referred to the orthodontics division, the CBCT was included as a portion of the usual pre-treatment record. There was no additional radiation exposure to the patient to collect data for our investigation. The study aimed to morphometrically evaluate condyle, joint spaces, and volume in different jaw base divergences using CBCT in the age group of 18–30 years clinically asymptomatic for pain and dysfunction. However, no significant co-relationship was found between condyle length and various jaw base divergences. It was found that the width, axis angulation, joint spaces, and volume of the condyle vary significantly in various jaw base divergences.
The study by Mohsen et al.[21] on the Chinese population concluded that the mandibular condyle width was not significantly different among different vertical malocclusions. Noh et al.[22] in their 3D evaluation study on the Korean population, found out that the hypodivergent group showed a greater condylar width than the hyperdivergent group. According to Wolff ’s law, the load placed on a bone affects both its internal architecture and morphology.[23]
Hypodivergent patients have higher maximum bite forces[24,25] conversely, due to a decrease in muscle tonicity, hyperdivergent patients exhibit reduced biting forces while clenching and chewing, affecting the condylar morphology.[26] The study on the Italian population by Ceratti et al.[27] concluded that patients with an increased divergence angle had smaller condylar volumes than subjects with normal or decreased mandibular plane divergence similar to our study. The present study findings are also concordant with those of a previous study done in Japan.[4] Cohlmia et al.[9] used CBCT to differentiate the size of the condyle in various jaw base divergences and concluded that the width of the condyle was found to be highest in the hypodivergent whereas it was least with respect to hyperdivergent group.
According to Park et al.,[3] subjects with a hyperdivergent skeletal pattern have narrow and highly positioned condyles when compared with a hypodivergent skeletal pattern. Burke et al.[11] research on the Canadian population and Alhammadi et al.[28] study on the Egyptian population found a substantial correlation between patients with a horizontal facial morphology and higher superior joint spaces and patients with a long face had decreased superior joint spaces, similar to our study. The mandibular condyle in long-face malocclusion may be positioned more anteriorly, causing the posterior condylar point to be distant from its corresponding point in the mandibular fossa, which could account for the greater posterior joint space. In our study, condylar axis angulation was found to be more in hyperdivergent than in hypodivergent or normodivergent individuals, indicating more anterior positioning of the condyle in the fossa. Previous literature on the condylar axis angulation is in agreement with our study results showing greater axis angulation in the hyperdivergent group, which could be due to backward growth rotation of the mandible.[28] In terms of the anteroposterior position of the mandibular condyle within the joint space, long, average, and short faces showed a position ranging from anterior to posterior. The idea that the mandibular condyle location in the fossa moves more anterior as the mandible rotates clockwise is consistent with the order of condylar position. Similar to the findings of Arieta-Miranda et al.,[29] the more superiorly positioned condyle was suggested in other research by approximating the condyle to the fossa floor.[20] The results of our study are concordant with Jyotirmay et al.[30] CBCT study concluded that the length of the condyle was identical in different vertical skeletal patterns without remarkable variation, whereas condyle width and height are highest in hypodivergent individuals and smallest in hyperdivergent individuals. A study on the Saudi Arabian population by Marghalani[31] found that there is a moderate association between the total combined condylar volume and the maxillomandibular difference. The results of our study are in concordance with the study by Sauccani et al.[10] which concluded that hypodivergent individuals have higher volume than normodivergent or hyperdivergent individuals. The results of our study are also similar to the study done on the Caucasian population by De Hierro Veronica et al.[32] which concluded that the vertical skeletal pattern appeared to be associated with a decreased mandibular condylar volume in the asymptomatic Caucasian orthodontic population. The technical word “stress” refers to the amount of force per unit area (Stress = force/area). Therefore, reducing the area or volume of the mandibular condyles may lead to an increase in the stress on the TMJs.
A study conducted on a mixed Indian population by Andhare et al.[33] concluded that condylar height is greater in hyperdivergent facial types than in normodivergent and hypodivergent types, and condylar axis angulation is greater in hypodivergent than in normodivergent and hyperdivergent types. The results of the above-mentioned study did not match those of our South Indian population study. The variation in results could be due to the study population’s ethnic diversity. Condyle size and volume vary in various jaw base divergences in the South Indian population. This is the first study to document condylar volumetric data for our population.
Clinical implications of the study
This study’s clinical implications can be explained by the fact that the width, axis angulation, volume, and position of the condyle differ with varying jaw base divergences. Detecting such variations and abnormalities is therefore critical, particularly during orthodontic treatment and orthognathic surgery, not to identify acceptable discrepancies as pathology and formulate an accurate treatment plan. Treatment outcomes would improve if condylar structure and position, as well as the centric relationship, were taken into consideration while treatment planning.
Limitations of the study
The present study did not take gender into consideration. Hence, larger sample sizes of our population for similar studies are advised for more accurate findings to ascertain the correlation between condylar morphology, various genders, and facial types. Our study included only one side of the condyle, considering the ethical issues and results of the previous studies, which proved that there is no statistical difference in various parameters in the right and left condyles.[10] However, studies conducted on different populations showed variations in width with respect to the right and left sides.[10] Hence, a larger sample with respect to both the right and left sides would enable the clinician to make the proper diagnosis based on expected growth patterns and predict the likely course of treatment to achieve the stable desired outcome.
CONCLUSION
Examining condylar morphology can reveal information about the developing facial type and potential malformations because the height, width, and volume of the condyle vary greatly in different jaw base divergences. Thus, this study can conclude that there is a significant correlation between condylar morphology and jaw base divergences. Hypodivergent individuals have condyles that are larger in size and volume, whereas hyperdivergent individuals have larger axis angulation and more superiorly positioned condyles. This relationship should be considered while planning orthodontic treatment.
Acknowledgment
We sincerely thank Dr. Ravi Shirahatti (Professor and Head, Department of Public Health Dentistry), SDM College of Dental Sciences and Hospital, for the statistical analysis.
Ethical approval
The research/study approved by the Institutional Review Board at Shri Dharmasthala Manjunatheshwara College of Dental Sciences and Hospital, Dharwad, India, number SDMCDSIEC.NO.2021/P/OR/73, dated February 27, 2023.
Declaration of patient consent
The authors certify that they have obtained all appropriate patient consent.
Conflicts of interest
There are no conflicts of interest.
Use of artificial intelligence (AI)-assisted technology for manuscript preparation
The authors confirm that there was no use of artificial intelligence (AI)-assisted technology for assisting in the writing or editing of the manuscript and no images were manipulated using AI.
Financial support and sponsorship
Nil.
References
- Improved visualization and assessment of condylar position in the glenoid fossa for different occlusions: A CBCT study. J Contemp Dent Pract. 2016;17:679-86.
- [CrossRef] [PubMed] [Google Scholar]
- Histologic examination of the temporomandibular joint after mandibular advancement with and without rigid fixation: An experimental investigation in adult Macaca mulatta. J Oral Maxillofac Surg. 1991;49:1316-27.
- [CrossRef] [PubMed] [Google Scholar]
- Three-dimensional conebeam computed tomography based comparison of condylar position and morphology according to the vertical skeletal pattern. Korean J Orthod. 2015;45:66-73.
- [CrossRef] [PubMed] [Google Scholar]
- Reliability of cone-beam computed tomography for temporomandibular joint analysis. Korean J Orthod. 2019;49:81-8.
- [CrossRef] [PubMed] [Google Scholar]
- Morphological and radiological variations of mandibular condyles in health and diseases: A systematic review. Dentistry. 2013;3:154.
- [CrossRef] [Google Scholar]
- Maxillofacial 3-dimensional image analysis for the diagnosis of facial asymmetry. Am J Orthod Dentofacial Orthop. 2006;130:779-85.
- [CrossRef] [PubMed] [Google Scholar]
- MRI and CBCT image registration of temporomandibular joint: A systematic review. J Otolaryngol Head Neck Surg. 2016;45:30.
- [CrossRef] [PubMed] [Google Scholar]
- Imaging of the temporomandibular joint: A position paper of the American Academy of Oral and Maxillofacial Radiology. Oral Surg Oral Med Oral Pathol Oral Radiol Endod. 1997;83:609-18.
- [CrossRef] [PubMed] [Google Scholar]
- Tomographic assessment of temporomandibular joints in patients with malocclusion. Angle Orthod. 1996;66:27-35.
- [Google Scholar]
- Do skeletal cephalometric characteristics correlate with condylar volume, surface and shape? A 3D analysis. Head Face Med. 2012;8:15.
- [CrossRef] [PubMed] [Google Scholar]
- Correlations between condylar characteristics and facial morphology in Class II preadolescent patients. Am J Orthod Dentofacial Orthop. 1998;114:328-36.
- [CrossRef] [PubMed] [Google Scholar]
- 3D slicer as an image computing platform for the quantitative imaging network. Magn Reson Imaging. 2012;30:1323-41.
- [CrossRef] [PubMed] [Google Scholar]
- Computed tomography evaluation of the temporomandibular joint in Class I malocclusion patients: Condylar symmetry and condyle-fossa relationship. Am J Orthod Dentofacial Orthop. 2009;136:192-8.
- [CrossRef] [Google Scholar]
- Computed tomography evaluation of the temporomandibular joint in Class II Division 1 and Class III malocclusion patients: Condylar symmetry and condyle-fossa relationship. Am J Orthod Dentofacial Orthop. 2009;136:199-206.
- [CrossRef] [PubMed] [Google Scholar]
- Variations in skeletal and dental patterns in patients with structural and functional alterations of the temporomandibular joint: A preliminary report. Am J Orthod. 1986;89:285-97.
- [CrossRef] [PubMed] [Google Scholar]
- Condylar height on panoramic radiographs a methodologic study with a clinical application. Acta Odontol Scand. 1994;52:43-50.
- [CrossRef] [PubMed] [Google Scholar]
- Assessment of condylar height and condylar axis angulation in different facial types in mixed Indian population: A CBCT study. EC Dent Sci. 2019;18:2187-95.
- [Google Scholar]
- Accuracy of linear temporomandibular joint measurements with cone beam computed tomography and digital cephalometric radiography. Am J Orthod Dentofacial Orthop. 2005;128:803-11.
- [CrossRef] [PubMed] [Google Scholar]
- Accuracy of panoramic radiography for degenerative changes of the temporomandibular joint. J Int Soc Prev Community Dent. 2020;10:96-100.
- [CrossRef] [PubMed] [Google Scholar]
- Morphology of the temporomandibular joint in study participants with Class II Division 2 malocclusions. Am J Orthod Dentofacial Orthop. 2006;129:470-8.
- [CrossRef] [PubMed] [Google Scholar]
- Three-dimensional evaluation of the mandibular condyle in adults with various skeletal patterns. Korean J Orthod. 2023;53:67-76.
- [CrossRef] [PubMed] [Google Scholar]
- Differences in mandibular condyle and glenoid fossa morphology in relation to vertical and sagittal skeletal patterns: A cone-beam computed tomography study. Korean J Orthod. 2021;51:126-34.
- [CrossRef] [PubMed] [Google Scholar]
- Masseter muscle thickness and mechanical advantage in relation to vertical craniofacial morphology in children. Acta Odontol Scand. 2008;66:23-30.
- [CrossRef] [PubMed] [Google Scholar]
- Occlusal forces in normal-and long-face adults. J Dent Res. 1983;62:566-70.
- [CrossRef] [Google Scholar]
- Effect of facial vertical pattern on mastication and its parameters [PhD dissertation Piracicaba: UNICAMP Universidade Estadual de Campinas; 2010.
- [Google Scholar]
- Cone-beam computed tomographic assessment of the mandibular condylar volume in different skeletal patterns: A retrospective study in adult patients. Bioengineering (Basel). 2022;9:102.
- [CrossRef] [PubMed] [Google Scholar]
- Comprehensive three-dimensional cone beam computed tomography analysis of the temporomandibular joint in different vertical skeletal facial patterns. J World Fed Orthod. 2016;5:9-17.
- [CrossRef] [Google Scholar]
- Spatial analysis of condyle position according to sagittal skeletal relationship, assessed by cone beam computed tomography. Prog Orthod. 2013;14:36.
- [CrossRef] [PubMed] [Google Scholar]
- Evaluation of Size of the Condyle in Vertical and Anteroposterior Skeletal Conditions with the Help of Cone-beam Computed Tomography. J Contemp Dent Pract. 2021;22:190-3.
- [CrossRef] [PubMed] [Google Scholar]
- Volumetric comparison of mandibular condyles and mandibles in the different skeletal classes in the Saudi population. PeerJ. 2024;12:e16750.
- [CrossRef] [PubMed] [Google Scholar]
- Evaluation of the mandibular condylar volume in different vertical patterns with cone beam computed tomography in young adult subjects. Clin Oral Sci Dent. 2019;1:1.
- [Google Scholar]
- Assessment of condylar height and condylar axis angulation in different facial types in mixed Indian population: A CBCT study. EC Dent Sci. 2019;18:2187-21.
- [Google Scholar]


