

Translate this page into:
Effect of maxillary distraction osteogenesis and LeFort-1 advancement orthognathic surgery on soft-tissue thickness and anterior soft-tissue to hard-tissue movement ratios among patients with complete unilateral cleft lip and palate

-
Received: ,
Accepted: ,
How to cite this article: Rajagopalan A, Verma S, Kumar V, Verma RK, Singh SP, Rattan V. Effect of maxillary distraction osteogenesis and LeFort-1 advancement orthognathic surgery on soft-tissue thickness and anterior soft-tissue to hard-tissue movement ratios among patients with complete unilateral cleft lip and palate. APOS Trends Orthod. 2024;14:115-23. doi: 10.25259/APOS_104_2023
Abstract
Objectives:
The objective of this study was to compare the soft-tissue thickness and anterior soft-tissue to hard-tissue movement ratios in patients with unilateral cleft lip and/or palate (UCLP) following maxillary distraction osteogenesis using rigid external distractor device and maxillary advancement at LeFort I level using lateral cephalograms.
Material and Methods:
This retrospective study was conducted on 20 patients with UCLP who underwent either LeFort I maxillary advancement or maxillary distraction osteogenesis. Non-syndromic patients with complete UCLP anomalies and skeletal class III patterns due to maxillary hypoplasia were included in the study. The patients with a pre-surgical negative overjet of ≥5 mm were treated by maxillary distraction osteogenesis, while a negative overjet of <5 mm was managed with maxillary advancement orthognathic surgery. The growth completion in all the patients was assessed using the cervical vertebrae maturation index (CS 6) on a lateral cephalogram. The lateral cephalograms taken before surgery at (T0) and after a minimum interval of six months (T1) of surgery were assessed for changes in soft-tissue thickness and hard-tissue to soft-tissue movement ratios among the two groups. Paired t-test was used to compare the mean values obtained within the same group at two different time intervals. Unpaired t-test was used to compare mean values between the Groups 1 and 2. Pearson’s correlation coefficient (r) test was used to assess the associations between the mean changes in hard- and soft-tissue variables.
Results:
Group 1 showed significantly greater maxillary advancement compared to Group 2 with a mean difference of 5.80 mm at Point A and 7.65 mm at the upper incisal edge. Soft-tissue thickness decreased significantly after advancement in Group 1 at subnasale (P < 0.05), labrale superius, stomion, and labrale inferius (P < 0.01) and at subnasale (P < 0.05), stomion and labrale inferius (P < 0.01) in Group 2. There was a significantly strong correlation between the hard- and soft-tissue movement in sagittal plane in both Group 1 and Group 2. In Groups 1 and 2, a statistical highly significant strong positive correlation was found between vertical change in dU1 to soft-tissue dLs and dStms. In Group 2, a statistical highly significant strong positive correlation was found between vertical change in dA to soft-tissue dC and dStms.
Conclusion:
The soft-tissue thickness reduced in patients with UCLP after maxillary advancement in both groups. The soft tissue followed the hard tissue in both groups. There was a greater downward movement of the maxillary base and soft-tissue lengthening in Group 1 compared to Group 2.
Keywords
Cleft lip and palate
Distraction osteogenesis
Soft-tissue thickness
LeFort I advancement
RED

INTRODUCTION
Midface hypoplasia, impaired growth, and a collapsed maxillary dental arch are some of the cardinal features of patients with cleft lip and palate (CL±P) anomaly. Conventional orthopedic/orthodontic approaches to treatments are sometimes successful in achieving stable occlusal relationships. However, sometimes they often fall short of expectations with respect to facial balance and esthetics. About one-quarter of patients with CL±P develop maxillary hypoplasia that cannot be corrected by orthodontic or orthopedic treatment alone and require orthosurgical intervention.[1]
The restoration of facial balance and occlusion in severe skeletal discrepancy due to hypoplastic maxilla requires LeFort 1 advancement. In CL±P patients, due to the postoperative difficulties caused by the palatal scar contracture, maxillary advancement of >5–6 mm requires distraction osteogenesis for stable results.[2-4]
Distraction osteogenesis technique has the advantage that allows a more gradual adaptation of surrounding soft-tissue drape and the palatal scar tissue, whereas this change is more acute in osteotomy cases, resulting in muscle imbalance and contractures.[5] When gradual distraction forces are applied across the osteotomy site, not only does the callus elongates, but also the soft tissues grow in response to mechanical stress. Not mere stretching, but hyperplasia of soft tissue occurs, and this is termed as Distraction Histogenesis, and the outcome achieved with this treatment modality is believed to be more stable than LeFort-1 maxillary advancement.[6]
The soft-tissue morphology and underlying hard tissue are closely related, and it is the soft-tissue profile of the patient that dictates the limits and esthetic outcomes of the treatment.[7] The soft-tissue thickness in patients with unilateral cleft lip and/or palate (UCLP) has been evaluated using cone-beam computed tomography[8] and lateral cephalogram.[9]
Ewing and Ross[9] found that soft-tissue changes following LeFort-1 maxillary advancement surgery in patients with UCLP were highly correlated with horizontal movement of the underlying skeletal bases with minimal changes in mandibular soft-tissue thickness. A systematic review conducted by Cheung and Chua[10] (2006) concluded that there were no significant changes in soft-tissue thickness of patients with UCLP who underwent maxillary osteotomies.
A significant number of patients with CL±P anomalies are treated with an interdisciplinary approach for the comprehensive cleft care in our center. There is controversy between the results of the previous studies regarding the effect of maxillary advancement on lip thickness. Furthermore, due to the difference in the mechanism of maxillary advancement using single-stage advancement and distraction, there may be differences in the soft-tissues changes in the two procedures. Thus, it is important to study the effects of the two procedures for future treatment planning.
Hence, the purpose of this study was to compare the soft-tissue thickness and anterior soft-tissue to hard-tissue movement ratios in patients with UCLP following maxillary distraction osteogenesis using a rigid external distractor device and maxillary advancement at LeFort I level.
MATERIAL AND METHODS
This retrospective study was conducted following the guidelines of the Declaration of Helsinki for medical protocol and ethics and approved by the Institutional Ethics Committee (NK/6890/MDS/775). A prior sample size was calculated using G* Power statistical software based on the study of Chua and Cheung[11] at alpha (α) value of 0.05, power of 90%, and 95% confidence interval. Power analysis showed a minimum of eight patients was required in each group.
A sample of 20 patients with complete UCLP with ten patients in each group were categorized into two groups. Group 1 comprised of seven male and three female patients with a mean age of 16.9 ± 3.11 years who underwent maxillary distraction osteogenesis at LeFort 1 level using Rigid External Distraction (RED) device; Group 2 comprised five males and five females with a mean age of 20 ± 4.29 years who underwent LeFort-1 maxillary advancement. The surgical procedures for all the subjects were performed by a single maxillofacial surgeon under general anesthesia. CL±P closure all the patients were done at the same institute, though the surgeons were different, following the same protocol.
The patients with a pre-surgical negative overjet of ≥5 mm were treated by maxillary distraction osteogenesis, while a negative overjet of <5 mm was managed with maxillary advancement orthognathic surgery. Non-syndromic patients with complete UCLP anomalies who underwent either maxillary distraction osteogenesis using a rigid external distraction device or maxillary advancement orthognathic surgery and skeletal class III pattern due to maxillary hypoplasia were included in the study. The growth completion in all the patients was assessed using the cervical vertebrae maturation index (CS 6) on lateral cephalogram.[12] All the patients received isolated maxillary surgery only. Those with bilateral CL±P, isolated clefts of the palate or lip, craniofacial syndromes, and faulty or incomplete records were excluded from the study. The lateral cephalograms were taken before surgery (T0) and at six-month (T1) post-surgery were assessed with manual tracing.
The investigator was calibrated for registration, landmark identification, and measurement of soft-tissue thickness on lateral cephalogram. The intraexaminer reliability was assessed by repeating the measurement of selected parameters on 10% of all the lateral cephalograms selected randomly after an interval of three weeks. The value of intra class correlation (ICC) ranged from 0.938 to 0.999, which indicated an excellent reliability between 1st and 2nd measurements.
Soft-tissue thickness[13] was calculated from hard tissue to corresponding soft-tissue landmarks, as shown in [Figure 1]. The changes in sagittal and vertical positions of the landmarks were assessed as perpendicular distances with respect to the horizontal reference line and vertical reference line reference planes at time interval (T0-T1), as shown in [Figure 2a and b]. Correlation between the anterior movement ratio of soft-tissue and hard-tissue landmarks was derived and compared between Group 1 and Group 2 patients.

- Cephalometric landmarks and various soft-tissue thickness measurements; 1: Glabella-Soft-tissue glabella, 2: Nasion-Soft-tissue Nasion, 3: Rhinion-soft-tissue rhinion, 4: Orbitale to Soft-tissue Orbitale, 5: Point A-Subnasale, 6: Prosthion-Labrale Superius, 7: Upper incisor tip-Stomion, 8: Infradentale-Labrale Inferius, 9: Point B-Labiomentale, 10: Pogonion to soft-tissue Pogonion. Green dots: Hard tissue landmarks Red dots: Soft tissue Landmarks.
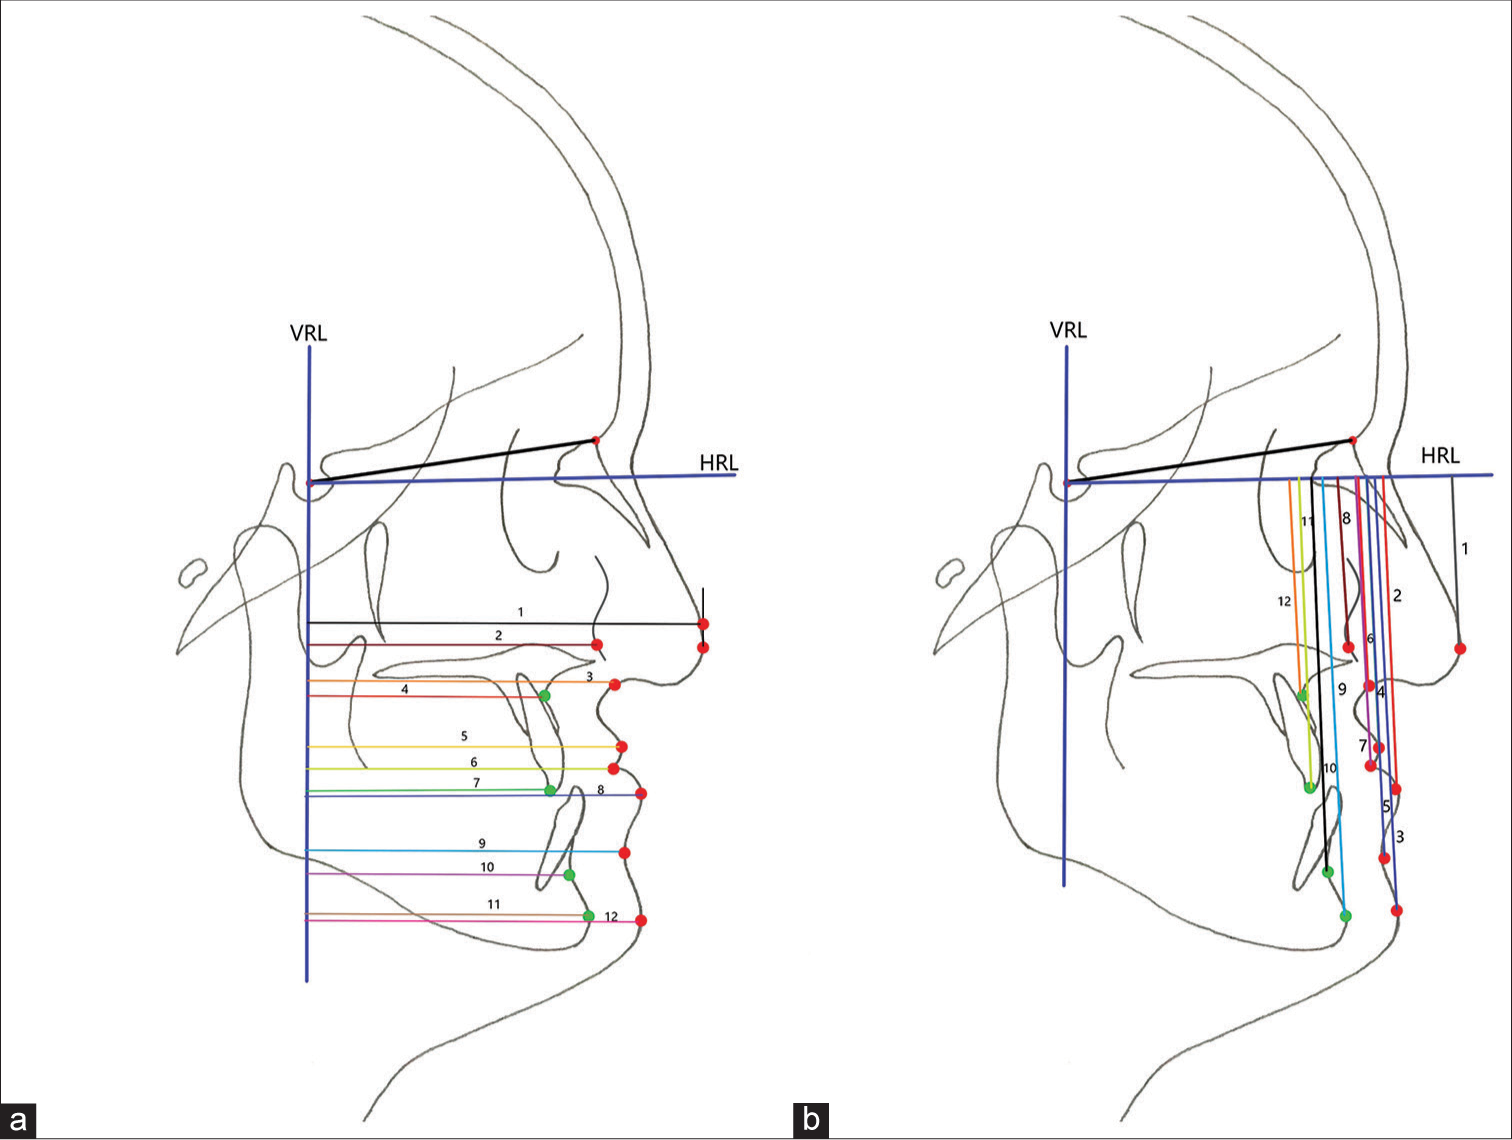
- (a) Horizontal distance from vertical reference line to hard-tissue (Green dot) and soft-tissue (Red dot) landmarks: Horizontal distance from VRL to: 1: Pronasale (Point located on a tangent drawn perpendicular to HRL from Pn to avoid overlapping of 1 and 2), 2: Cheek point, 3: Subnasale, 4: Point A, 5: Labrale superius, 6: Stomion, 7: Upper incisor tip, 8: Labrale inferius, 9: Labiomentale, 10: Point B, 11: Pogonion, 12: Soft-tissue Pogonion. (b): Vertical distance from HRL to hard-tissue (Green dot) and soft-tissue (Red dot) landmarks: Vertical distance from HRL to: 1: Pronasale, 2: Labrale Inferius, 3: Soft-tissue Pogonion, 4: Labrale superius, 5: Labiomentale, 6: Subnasale, 7: Stomion, 8: Cheekpoint, 9: Pogonion, 10: Point B, 11: Upper incisor tip, 12: Point A, VRL: Vertical reference line, HRL: Horizontal reference line.
Statistical analysis
Statistical analysis were performed using the Statistical Package for the Social Sciences version 25.0 and MedCalc software. The data followed normal distribution as analyzed by Shapiro–Wilk test. Paired t-test was used to evaluate intragroup differences at two different time-intervals. Pearson’s correlation coefficient test was used to assess the associations between the mean change in hard- and soft-tissue variables. The level of significance was set at P < 0.05.
RESULTS
The pre-surgical comparison of skeletal dysplasia (Wits appraisal) and overjet between Group 1 and Group 2 was statistically significant; however, the differences among various soft-tissue thickness parameters were statistically insignificant [Table 1]. In Group 1, soft-tissue thickness decreased (T0-T1) significant at subnasale, labrale superius, stomion, and labrale inferius (P < 0.05). Group 2 also showed significant decrease in soft-tissue thickness at subnasale, labrale inferius, and stomion (P < 0.05). The intergroup comparison showed a significantly greater decrease in soft-tissue thickness in Group 1 at labrale superius, stomion, and labrale inferius [Table 2].
| Group 1 | Group 2 | Total | ||
|---|---|---|---|---|
| Male | 7 (70%) | 5 (50%) | 12 (60%) | |
| Female | 3 (30%) | 5 (50%) | 8 (40%) | |
| Age (Range) | 14–21 | 16–24 | 14–24 | |
| Age (Mean±SD) | 16.9±3.11 | 20±4.29 | 17.6±4.38 | |
| P-value | ||||
| Wits appraisal (mm) | −7.3±2.95 | −3.5±2.47 | 0.0052** | |
| Negative overjet (mm) | −7.15±1.93 | −2.1±0.57 | <0.0001*** | |
| Soft-tissue thickness (mean±SD) | Group 1 | Group 2 | MD | P-value |
| Glabella (G-G’) (mm) | 5.90±1.54 | 5.80±1.03 | −0.10 | 0.866 (NS) |
| Nasion (N-N’) (mm) | 5.75±1.84 | 6.20±2.39 | 0.45 | 0.642 (NS) |
| Rhinion (Rh -Rh’) (mm) | 3.45±1.44 | 2.90±0.61 | −0.55 | 0.280 (NS) |
| Subnasale (Point A-Sn) (mm) | 13.40±2.58 | 14.80±2.81 | 1.40 | 0.261 (NS) |
| Labrale superius (Pr-Ls) (mm) | 13.45±2.60 | 14.30±2.81 | 0.85 | 0.491 (NS) |
| Stomion (U1-St) (mm) | 15.00±2.35 | 14.65±3.49 | −0.35 | 0.795 (NS) |
| Labrale inferius (Id-Li) (mm) | 10.90±2.67 | 8.45±3.16 | −2.45 | 0.077 (NS) |
| Labiomentale (Point B-Lm) (mm) | 15.40±1.07 | 15.80±1.96 | 0.40 | 0.578 (NS) |
| Orbitale (Or-C) | 11.50±1.55 | 11.10±1.73 | −0.40 | 0.592 (NS) |
| Pogonion (Pog-Pog’) (mm) | 12.20±2.54 | 11.95±2.75 | −0.25 | 0.835 (NS) |
NS: Non significant (P>0.05), SD: Standard deviation, MD: Mean difference, **Highly significant (P<0.01), ***Very high significant (P<0.001)
| Parameters (mm) | Mean±SD | Gp 1-Gp 2 | |||||||
|---|---|---|---|---|---|---|---|---|---|
| Group 1 | Group 2 | ||||||||
| T0 | T1 | T0-T1 | P-value | T0 | T1 | T0-T1 | P-value | P-value | |
| Glabella (G-G’) | 5.90±1.54 | 5.80±1.57 | 0.10±0.32 | 0.343 (NS) | 5.80±1.03 | 5.55±0.69 | 0.25±0.72 | 0.299 (NS) | 0.552 (NS) |
| Nasion (N-N’) | 5.75±1.84 | 5.75±1.53 | 0.00±0.91 | 1.000 (NS) | 6.20±2.39 | 6.25±2.47 | −0.05±2.17 | 0.943 (NS) | 0.947 (NS) |
| Rhinion (Rh -Rh’) | 3.45±1.44 | 3.55±1.40 | −0.10±0.21 | 0.168 (NS) | 2.90±0.61 | 3.50±0.85 | −0.60±0.84 | 0.051 (NS) | 0.086 (NS) |
| Subnasale (Point A-Sn) | 13.40±2.58 | 11.75±2.60 | 1.65±1.70 | 0.013* (NS) | 14.80±2.81 | 11.60±2.92 | 3.20±2.07 | 0.001** | 0.084 (NS) |
| Labrale Superius (Pr-Ls) | 13.45±2.60 | 11.10±2.45 | 2.35±2.04 | 0.005** | 14.30±2.81 | 14.20±3.05 | 0.10±1.71 | 0.858 (NS) | 0.016* |
| Stomion (U1-St) | 15.00±2.35 | 11.35±2.68 | 3.65±2.38 | 0.001** | 14.65±3.49 | 13.75±3.32 | 0.90±1.15 | 0.035* | 0.004** |
| Labrale Inferius (Id-Li) | 10.90±2.67 | 5.65±2.57 | 5.25±2.88 | 0.001** | 8.45±3.16 | 7.15±2.90 | 1.30±1.32 | 0.012* | 0.001** |
| Labiomentale (Point B-Lm) |
15.40±1.07 | 16.05±1.48 | −0.65±1.65 | 0.245 (NS) | 15.80±1.96 | 15.25±1.96 | 0.55±0.98 | 0.111 (NS) | 0.064 (NS) |
| Orbitale (Or-C) | 11.50±1.55 | 12.15±2.44 | −0.65±1.68 | 0.253 (NS) | 11.10±1.73 | 10.80±1.32 | 0.30±0.63 | 0.168 (NS) | 0.112 (NS) |
| Pogonion (Pog-Pog’) | 12.20±2.54 | 12.30±2.02 | −0.10±1.54 | 0.842 (NS) | 11.95±2.75 | 11.89±1.90 | 0.06±1.40 | 0.895 (NS) | 0.811 (NS) |
NS: Non significant (P>0.05), *Significant (P<0.05), **Highly significant (P<0.01), SD: Standard deviation
Comparison of sagittal movement of various hard- and soft-tissue landmarks in Group 1 and Group 2 is shown in [Table 3]. The intragroup mean maxillary advancement in Group 1 and Group 2 was statistically significant at point A and upper incisal edge (P < 0.01). The intergroup comparison showed significantly greater maxillary advancement in Group 1 at Point A and upper incisal edge (P < 0.01). Group 1 showed greater advancements at Subnasale (P < 0.05), Labrale Superius, and Stomion (P < 0.01) as compared to Group 2. Downward displacement of Point A (P < 0.01), pogonion (Pog), labrale inferius, labiomentale, and soft-tissue pogonion (P < 0.05) was also greater in Group 1 when compared to Group 2 [Table 4].
| Variable | Group 1 | Group 2 | Gp 1-Gp 2 | ||||||
|---|---|---|---|---|---|---|---|---|---|
| Mean±SD | MD (T1-T0) | P-value | Mean±SD | MD (T1-T0) | P-value | P-value | |||
| T0 | T1 | T0 | T1 | ||||||
| Soft tissue | |||||||||
| VRL to C (cheek point) | 60.85±5.89 | 63.75±7.00 | −2.90 | 0.022* | 57.45±9.18 | 59.90±10.09 | −2.45 | 0.005** | 0.721 (NS) |
| VRL to Pn | 84.75±8.52 | 88.40±8.88 | −3.65 | 0.003** | 80.85±16.64 | 82.25±18.03 | −1.40 | 0.063 (NS) | 0.061 (NS) |
| VRL to Sn | 69.10±7.60 | 75.85±8.33 | −6.75 | 0.001** | 65.90±10.84 | 67.60±12.28 | −1.70 | 0.420 (NS) | 0.039* |
| VRL to Ls | 70.70±8.39 | 79.35±9.42 | −8.65 | 0.001** | 67.45±10.19 | 70.80±10.51 | −3.35 | 0.006** | 0.003** |
| VRL to Stms | 66.30±8.52 | 74.00±9.54 | −7.70 | 0.001** | 62.75±9.82 | 66.10±9.68 | −3.35 | 0.018* | 0.030* |
| VRL to Li | 77.90±10.45 | 79.60±10.19 | −1.70 | 0.249 (NS) | 73.00±10.31 | 72.05±9.80 | 0.95 | 0.341 (NS) | 0.130 (NS) |
| VRL to Lm | 69.05±10.91 | 69.50±10.78 | −0.45 | 0.769 (NS) | 65.30±12.29 | 65.30±11.31 | 0.00 | 1.000 (NS) | 0.791 (NS) |
| VRL to Pog’ | 71.10±12.01 | 71.10±11.49 | 0.00 | 1.000 (NS) | 68.25±14.95 | 68.60±13.69 | −0.35 | 0.747 (NS) | 0.853 (NS) |
| Hard tissue | |||||||||
| VRL to Point B | 57.90±10.64 | 57.80±10.36 | 0.10 | 0.943 (NS) | 55.80±14.40 | 55.75±13.68 | 0.05 | 0.945 (NS) | 0.974 (NS) |
| VRL to Pog | 59.70±11.65 | 59.55±11.27 | 0.15 | 0.928 (NS) | 59.40±17.91 | 58.90±18.07 | 0.50 | 0.712 (NS) | 0.868 (NS) |
| VRL to Point A | 55.85±6.56 | 65.25±7.61 | −9.40 | 0.001*** | 53.55±7.79 | 57.15±7.61 | −3.60 | 0.001*** | 0.001** |
| VRL to U1 | 55.65±8.58 | 68.85±9.51 | −13.20 | 0.001*** | 55.30±9.81 | 60.85±8.32 | −5.55 | 0.002** | 0.001** |
VRL: Vertical reference line, SD: Standard deviation, MD: Mean difference, NS: Non significant (P>0.05), *Significant (P<0.05), **Highly significant (P<0.01), ***Very high significant (P<0.001), Pn: Pronasale; Sn: Subnasale; Ls: Labrale superius; Stms: Stomion superius; Li: Labrale inferius; Lm: Labiomentale; Pog: Pogonion; U1: Upper incisor tip.
| Variable | Group 1 | Group 2 | Group 1-Group 2 | ||||||
|---|---|---|---|---|---|---|---|---|---|
| Mean±SD | MD (T1-T0) | P-value | Mean±SD | MD (T1-T0) | P-value | P-value | |||
| T0 | T1 | T0 | T1 | ||||||
| Soft tissue | |||||||||
| HRL to C (cheek point) | 34.65±3.70 | 34.50±3.27 | 0.15 | 0.671 (NS) | 38.45±10.97 | 37.80±10.93 | 0.65 | 0.454 (NS) | 0.584 (NS) |
| HRL to Pn | 36.15±4.09 | 35.30±3.77 | 0.85 | 0.212 (NS) | 41.50±18.75 | 40.50±18.81 | 1.00 | 0.204 (NS) | 0.878 (NS) |
| HRL to Sn | 45.45±4.60 | 44.65±3.84 | 0.80 | 0.196 (NS) | 49.15±11.24 | 48.65±11.77 | 0.50 | 0.221 (NS) | 0.668 (NS) |
| HRL to Ls | 55.30±4.84 | 56.95±3.95 | −1.65 | 0.188 (NS) | 59.85±10.27 | 59.80±10.21 | 0.05 | 0.931 (NS) | 0.203 (NS) |
| HRL to Stms | 60.70±5.59 | 63.15±4.50 | −2.45 | 0.049* | 64.60±9.34 | 65.30±9.02 | −0.70 | 0.200 (NS) | 0.227 (NS) |
| HRL to Li | 68.80±5.76 | 72.05±5.34 | −3.25 | 0.049* | 72.15±9.85 | 71.50±9.32 | 0.65 | 0.477 (NS) | 0.045* |
| HRL to Lm | 79.25±6.34 | 81.80±6.35 | −2.55 | 0.126 (NS) | 79.95±10.55 | 79.55±11.26 | 0.40 | 0.443 (NS) | 0.048* |
| HRL to Pog’ | 89.10±7.05 | 92.65±7.39 | −3.55 | 0.049* | 90.15±13.36 | 90.45±12.46 | −0.30 | 0.709 (NS) | 0.041* |
| Hard tissue | |||||||||
| HRL to Point A | 45.25±3.27 | 45.70±4.60 | −0.45 | 0.700 (NS) | 47.95±8.39 | 48.15±8.20 | −0.20 | 0.705 (NS) | 0.843 (NS) |
| HRL to U1 | 61.35±4.93 | 65.50±3.82 | −4.15 | 0.001** | 63.30±8.45 | 63.25±8.20 | 0.05 | 0.907 (NS) | 0.001** |
| HRL to Point B | 81.60±7.58 | 82.45±7.85 | −0.85 | 0.589 (NS) | 79.85±12.97 | 79.00±13.17 | 0.85 | 0.101 (NS) | 0.298 (NS) |
| HRL to Pog | 91.80±6.65 | 92.35±5.22 | −0.55 | 0.063 | 92.10±16.53 | 91.35±16.90 | 0.75 | 0.224 (NS) | 0.023* |
HRL: Horizontal reference line, SD: Standard deviation, MD: Mean difference, NS: Non significant (P>0.05), ***Very high significant (P<0.001), *Significant (P<0.05), **Highly significant (P<0.01), Pn: Pronasale; Sn: Subnasale; Ls: Labrale superius; Stms: Stomion superius; Li: Labrale inferius; Lm: Labiomentale; Pog: Pogonion; U1: Upper incisor tip
The sagittal change in the hard-tissue parameters at dA, dU1, dB, and dPog was found to be positive and strongly correlated with the respective soft-tissue parameters except dC for Group 1 and dSn and dPog’ in Group 2 [Table 5]. In Group 1, a statistically highly significant strong positive correlation was found between vertical change in dU1 to soft-tissue dLs and dStms. In Group 2, change in hard-tissue point A was positively correlated with soft-tissue point dC and dStms and dU1 with dLs and dStm [Table 6].
| S. No. | Parameters | Group 1 | Group 2 | |||||
|---|---|---|---|---|---|---|---|---|
| Hard tissue | Soft tissue | R-value | P-value | S: H | R-value | P-value | S: H | |
| 1. | dA | dC | 0.499 | 0.142 (NS) | 0.42:1 | 0.630 | 0.049* | 0.54:1 |
| 2. | dSn | 0.900 | 0.001** | 0.76:1 | 0.113 | 0.757 (NS) | 0.29:1 | |
| 3. | dLs | 0.824 | 0.003** | 0.82:1 | 0.885 | 0.001** | 1.07:1 | |
| 4. | dStms | 0.815 | 0.004** | 0.94:1 | 0.851 | 0.002** | 1.29:1 | |
| 5. | dPn | 0.788 | 0.007** | 0.57:1 | 0.839 | 0.002** | 0.72:1 | |
| 6. | dU1 | dLs | 0.911 | 0.001** | 0.86:1 | 0.848 | 0.002** | 0.61:1 |
| 7. | dStms | 0.884 | 0.001** | 0.94:1 | 0.723 | 0.018* | 0.65:1 | |
NS: Non significant (P>0.05), ***Very high significant (P<0.001), *Significant (P<0.05), **Highly significant (P<0.01). dA: Change in position of Point A (T0-T1), dU1:Change in position of Upper Incisor (T0-T1), dC: Change in position of Cheek point (T0-T1), dSn: Change in position of subnasale (T0-T1), dLs: Change in position of Labrale superius (T0-T1), dStms: Change in position of Stomion superius (T0-T1), dPn: Change in position of Pronasale (T0-T1), dLs: Change in position of Labrale superius (T0-T1), dStms: Change in position of Stomion superius (T0-T1).
| S. No. | Parameters | Group 1 | Group 2 | |||||
|---|---|---|---|---|---|---|---|---|
| Hard tissue | Soft tissue | R-value | P-value | S:H | R-value | P-value | S:H | |
| 1. | dA | dC | −0.555 | 0.096 (NS) | −0.16:1 | 0.655 | 0.040* | 1.06:1 |
| 2. | dSn | −0.011 | 0.976 (NS) | −0.00:1 | 0.157 | 0.665 (NS) | 0.12:1 | |
| 3. | dLs | 0.156 | 0.668 (NS) | 0.16:1 | 0.503 | 0.138 (NS) | 0.55:1 | |
| 4. | dStms | 0.265 | 0.459 (NS) | 0.30:1 | 0.625 | 0.045* | 0.62:1 | |
| 5. | dPn | −0.189 | 0.601 (NS) | −0.10:1 | 0.490 | 0.150 (NS) | 0.70:1 | |
| 6. | dU1 | dLs | 0.826 | 0.003** | 0.60:1 | 0.822 | 0.004** | 1.11:1 |
| 7. | dStms | 0.904 | 0.001** | 1.40:1 | 0.727 | 0.017* | 0.88:1 | |
NS: Non significant (P>0.05), ***Very high significant (P<0.001), *Significant (P<0.05), **Highly significant (P<0.01), dA: Change in position of Point A (T0-T1), dU1:Change in position of Upper Incisor (T0-T1), dC: Change in position of Cheek point (T0-T1), dSn: Change in position of subnasale (T0-T1), dLs: Change in position of Labrale superius (T0-T1), dStms: Change in position of Stomion superius (T0-T1), dPn: Change in position of Pronasale (T0-T1), dLs: Change in position of Labrale superius (T0-T1), dStms: Change in position of stomion superius (T0-T1).
DISCUSSION
The treatment modality for maxillary retrognathism in adult patients with CL±P is based on the extent of the deformity, degree of desirable jaw movement, and anticipated soft-tissue changes following surgical intervention.[14] Traditional orthodontic and or orthopedic approaches, such as Facemask therapy to treat these patients in growing stage, often fall short of expectations with respect to facial balance and esthetics, despite obtaining a stable occlusal relationship.
In the present study, there was a significant difference of 5.80 mm in maxillary advancement between Group 1 and Group 2 as measured at Point A (U1), and the results were similar to the previous study by Markose et al.[15] and Chua and Cheung.[11]
Change in soft-tissue thickness and soft-tissue to hard- tissue movement ratios in maxillary distraction group
Significant decrease in soft-tissue thickness was observed at subnasale (P < 0.05), labrale superius, labrale inferius, and stomion superius (P < 0.01) post-distraction in Group 1 patients. The decrease in soft-tissue thickness at subnasale (1.65mm) in the present study was slightly greater than Ko et al.[16] who reported a mean change in soft-tissue thickness of 1.05 mm. However, a decrease in soft-tissue thickness at lower lip of 5.25 mm in the present study was markedly greater than reported by Ko et al.[16] (0.83 mm). The marked change in thickness at the lower lip may have been contributed by the support provided by maxillary anterior teeth following maxillary distraction. The additional support provided to the nasal base and lower lip following maxillary advancement explains the decrease in soft-tissue thickness at subnasale and labrale inferius. The significant improvement in the nasal tip projection was explained by the direct effect of maxillary advancement on the ANS and subsequently on the nasal tip.
In the sagittal plane, except for Cheekpoint, other soft-tissue landmarks correlated well with the advancement of Point A. Change in subnasale, labrale superius, stomion superius, and pronasale correlated significantly with the movement at Point A with soft-tissue to hard-tissue ratios of 0.76:1, 0.82:1, 0.94:1, and 0.57:1, respectively. Chua and Cheung[11] also reported similar significant correlations between movement of Point A and the respective soft-tissue landmarks post-distraction using an internal distractor,unlike the present study. Correlations between anterior movement of U1 and labrale superius and stomion superius were also found to be significant in the present study (P < 0.01) with movement ratios of 0.86:1 and 0.94:1, respectively. Results on the anterior movement ratio for soft- to hard-tissue in the distraction group share a tendency similar to the study by Ko et al.,[16] one-year after maxillary advancement using a rigid external distractor.
There was a significant downward movement of the upper incisal edge by 4.15 mm, stomion superius by 2.45 mm, and labrale inferius by 3.25 mm in Group 1 patients (P < 0.01). Figueroa and Polley[17] reported a non-significant downward displacement of maxilla at incisal edge by 1.3 mm and Sahoo et al.[18] (2015) also reported a significant downward displacement of the upper incisor by 7.7 mm. This maxillary downward displacement may be due to the alignment of the force vector using the RED that passed above the center of resistance of the maxillary base that resulted in the downward advancement of the maxilla. The lengthening of the soft-tissue drape at Stms and Li in Group 1 was similar to the findings of Harada et al.[19] who also reported subnasal and lip lengthening following maxillary distraction. This can possiblybe attributed to the histogenesis that accompanies maxillary distraction.
Change in soft-tissue thickness and soft-tissue to hard-tissue movement ratios in LeFort-1 maxillary advancement group
Significant decrease in soft-tissue thickness was observed at subnasale (P < 0.01) by 3.02 mm, labrale inferius by 1.30 mm, and at stomion superius by 0.90 mm (P < 0.05) post LeFort 1 maxillary advancement in Group 2 patients. According to Ewing and Ross,[9] only maxillary advancements of >4 mm produced significant thinning of the upper lip. Thus, a mean maxillary advancement of 3.60 mm in the present study may explain the non-significant decrease in soft-tissue thickness at labrale superius by 0.10 mm. Furthermore, it had also been hypothesized by Epker et al.[20] (1978) that previous lip surgery might leave patients with cleft with lips that were less compressible during LeFort-1 advancement. Heliövaara et al.[21] observed upper lip thinning by 1.6 mm, and Susarla et al.[22] reported upper lip thinning by 5.8 ± 2.5 mm. Such variable results may be due to variations in patient posture or forceful lip closure/strain while taking the lateral cephalograms.
In the sagittal plane, significant correlation was found between advancement at Point A and changes at C point, labrale superius, stomion superius, and pronasale in the ratios of 0.54:1, 1.07:1, 1.29:1, and 0.72:1, respectively. Lines and Steinhauser[23] found that there was a change in the nasal shape and the nasal tip position in a ratio of 2:3 compared to hard-tissue movement based on the finding of three cleft patients treated with maxillary advancement. Freihofer’s analysis of changes in nasal profile after maxillary advancement in 25 cleft cases showed a mean ratio of soft- to hard-tissue change of 0.3,[24] less than half the value reported earlier by Lines and Steinhauser[23]. Other values reported are 0.13 by Hui et al.[25] and 0.3 by Araujo et al.[26] (1978). The changes in upper lip position following LeFort I osteotomy also show significant variation from one author to another. The ratio of soft- to hard-tissue advancement at Ls ranges from 0.4:1 to 0.66:1 for the majority of authors like Lines and Steinhauser,[23] Freihofer,[24] Araujo et al.[26] (1978), McCarthy et al.,[6] Ewing and Ross,[9] and Hui et al.[25]
Vertical lengthening of soft-tissue drape observed in Group 1 was not observed in Group 2,which was similar to the findings of Heliövaara et al.[21] This is possibly explained by the one-step advancement of the cleft maxilla,unlike the gradual advancement during distraction and the subsequent soft-tissue adaptation.
It may be inferred from this study that both the surgical interventions for maxillary advancement produce significant changes in the soft and hard tissue. It may be further implied that the soft tissue follows the hard tissue postsurgically. The ratios obtained from the study may be useful in the prediction of profile changes and treatment planning for maxillary advancement or distraction.
Limitations of the study
The primary limitation was the smaller sample size in the study. Therefore, future studies with larger sample size are recommended. In future, prospective studies and clinical trials are thus recommended with a larger sample size.
CONCLUSION
In both groups, soft-tissue thickness was significantly reduced at subnasale, stomion, and labrale inferius (lower lip); however, reduction in thickness was not significant at labrale superius after LeFort 1 advancement surgery.
The sagittal movement of all soft-tissue landmarks strongly correlated with movement of the corresponding hard-tissue landmarks in both Group 1 and Group 2.
A marked positive and strong correlation was found between labrale superius and stomion points to the downward movement of the upper incisal edge in both Group 1 and Group 2.
There was significant soft-tissue lengthening at subnasale and the upper lip following maxillary distraction in Group 1.
Ethical approval
The research/study approved by the Institutional Review Board at PGIMER, Chandigarh, number NK/6890/MDS/775, dated 11-01-2021.
Declaration of patient consent
The authors certify that they have obtained all appropriate patient consent.
Conflicts of interest
There are no conflicts of interest.
Use of artificial intelligence (AI)-assisted technology for manuscript preparation
The authors confirm that they have used artificial intelligence (AI)-assisted technology for assisting in the writing or editing of the manuscript or image creations.
Financial support and sponsorship
Nil.
References
- Treatment variables affecting facial growth in complete unilateral cleft lip and palate. Cleft Palate J. 1987;24:5-77.
- [Google Scholar]
- Stability after surgical-orthodontic correction of skeletal Class III malocclusion. 2. Maxillary advancement. Int J Adult Orthodon Orthognath Surg. 1991;6:71-80.
- [Google Scholar]
- The skeletal stability of one-piece Le Fort 1 osteotomy to advance the maxilla; Part 1. Stability resulting from non-bone grafted rigid fixation. Br J Oral Maxillofac Surg. 2004;42:221-5.
- [CrossRef] [Google Scholar]
- Long-term skeletal stability after rigid fixation of Le Fort I osteotomies with advancements. Int J Oral Maxillofac Surg. 1993;22:82-6.
- [CrossRef] [PubMed] [Google Scholar]
- Distraction osteogenesis of the human craniofacial skeleton: Initial experience with a new distraction system. J Craniofac Surg. 1995;6:368-74.
- [CrossRef] [PubMed] [Google Scholar]
- Lengthening the human mandible by gradual distraction. Plast Reconstr Surg. 1992;89:1-8. discussion 9-10
- [CrossRef] [Google Scholar]
- Assessment of the facial soft tissue thickness of the patients affected by unilateral cleft lip and palate using cone beam computed tomography. J Craniofac Surg. 2015;26:1647-51.
- [CrossRef] [PubMed] [Google Scholar]
- Cephalometric soft tissue profile in unilateral cleft lip and palate patients. Eur J Orthod. 2002;24:277-84.
- [CrossRef] [PubMed] [Google Scholar]
- Soft tissue response to orthognathic surgery in persons with unilateral cleft lip and palate. Cleft Palate Craniofac J. 1993;30:320-7.
- [CrossRef] [PubMed] [Google Scholar]
- A meta-analysis of cleft maxillary osteotomy and distraction osteogenesis. Int J Oral Maxillofac Surg. 2006;35:14-24.
- [CrossRef] [PubMed] [Google Scholar]
- Soft tissue changes from maxillary distraction osteogenesis versus orthognathic surgery in patients with cleft lip and palate-a randomized controlled clinical trial. J Oral Maxillofac Surg. 2012;70:1648-58.
- [CrossRef] [PubMed] [Google Scholar]
- The cervical vertebral maturation (CVM) method for the assessment of optimal treatment timing in dentofacial orthopedics. Semin Orthod. 2005;11:119-29.
- [CrossRef] [Google Scholar]
- Soft tissue profile changes following mandibular advancement surgery: Predictability and long-term outcome. Am J Orthod Dentofacial Orthop. 2001;119:353-67.
- [CrossRef] [PubMed] [Google Scholar]
- Distraction osteogenesis in oral and craniomaxillofacial reconstructive surgery. London: Intech Open; 2018
- [CrossRef] [Google Scholar]
- Soft tissue changes in cleft lip and palate patients: Anterior maxillary distraction versus conventional le-fort I osteotomy. J Maxillofac Oral Surg. 2013;12:429-35.
- [CrossRef] [PubMed] [Google Scholar]
- Soft tissue profile changes after maxillary advancement with distraction osteogenesis by use of a rigid external distraction device: A 1-year follow-up. J Oral Maxillofac Surg. 2000;58:959-69.
- [CrossRef] [PubMed] [Google Scholar]
- Management of severe cleft maxillary deficiency with distraction osteogenesis: Procedure and results. Am J Orthod Dentofacial Orthop. 1999;115:1-12.
- [CrossRef] [PubMed] [Google Scholar]
- Evaluation of the hard and soft tissue changes after maxillary advancement with rigid external distractor in unilateral cleft lip and palate induced maxillary hypoplasia. Med J Armed Forces India. 2015;71:S355-61.
- [CrossRef] [PubMed] [Google Scholar]
- Soft tissue profile changes of the midface in patients with cleft lip and palate following maxillary distraction osteogenesis: A preliminary study. Oral Surg Oral Med Oral Pathol Oral Radiol Endod. 2002;94:673-7.
- [CrossRef] [PubMed] [Google Scholar]
- The surgical-orthodontic correction of maxillary deficiency. Oral Surg Oral Med Oral Pathol. 1978;46:171-205.
- [CrossRef] [PubMed] [Google Scholar]
- Changes in soft tissue thickness after Le Fort I osteotomy in different cleft types. Int J Adult Orthodon Orthognath Surg. 2001;16:207-13.
- [Google Scholar]
- Midfacial volumetric and upper lip soft tissue changes after Le Fort I advancement of the cleft maxilla. J Oral Maxillofac Surg. 2015;73:708-18.
- [CrossRef] [PubMed] [Google Scholar]
- Diagnosis and treatment planning in surgical orthodontic therapy. Am J Orthod. 1974;66:378-97.
- [CrossRef] [PubMed] [Google Scholar]
- Changes in nasal profile after maxillary advancement in cleft and non-cleft patients. J Maxillofac Surg. 1977;5:20-7.
- [CrossRef] [PubMed] [Google Scholar]
- Soft tissue changes following maxillary osteotomies in cleft lip and palate and non-cleft patients. J Cranio Maxillofac Surg. 1994;22:182-6.
- [CrossRef] [PubMed] [Google Scholar]
- Total maxillary advancement with and without bone grafting. J Oral Surg. 1978;36:849-58.
- [Google Scholar]


