

Translate this page into:
Evaluation of Buccal Cortical Bone Thickness in Wet Mandibles from Cadavers Using Computed Tomography Scan and Stereomicroscope
Address for correspondence: Dr. Kyumi Vinod Shethiya, 2/33, Bhuta Niwas, Dr. Ambedkar Road, Matunga, Mumbai - 400 019, Maharashtra, India. E-mail: kyumishethiya@gmail.com
This article was originally published by Wolters Kluwer and was migrated to Scientific Scholar after the change of Publisher.
Abstract
Introduction
Cortical bone thickness is an important factor in mini implant stability. Many studies have evaluated cortical bone thickness by different methods, but this study is a step ahead in measuring cortical bone in wet mandibles from cadavers comparing thickness values from computed tomograms to images from a stereomicroscope (SM). In this study, we investigated buccal cortical bone thickness at three interdental areas using computed tomography (CT) scan and SM.
Methods
From the CT scans of 30 wet human cadaveric mandibles, 2-dimensional slices through three interdental area (mesial of canine, interpremolar, and inter-molar) were generated. On these, cortical bone thickness was measured at 2, 4, and 6 mm from the cementoenamel junction (CEJ). The cortical bone thickness at same areas was compared with an SM.
Results
By both methods, it was observed that thickness of cortical bone increased from mesial of canines toward the premolar region and then decreased in the molar region. Increase in thickness of cortical bone was observed with increase in height from the CEJ toward the apical region up to 6 mm. CT scans underestimated the measurements as compared to the SM method.
Conclusions
The mean buccal cortical bone thickness at all interdental sites at 2, 4, and 6 mm from CEJ was 1.7 ± 0.4 by the CT scan method and 1.9 ± 0.5 by the SM method, indicating that results observed with the CT method were underestimated by 11% than SM method.
Keywords
Cortical bone thickness
ct scans
mini-implant stability
stereomicroscope

Introduction
Absolute anchorage has been a long sought after but rarely achieved, treatment ideal. Therefore, orthodontic mini-implants, which can provide this desired form of Anchorage, are becoming more popular than ever. Popular implant sites appear to be the palate, the lingual aspect of the maxillary alveolar process, the retromolar area in the mandible, and the buccal cortical plate in the maxilla and the mandible.[1-6] The latter has proven to be a versatile placement site and has thus been the subject of several investigations.[7-9]
Two factors affect the stability of a screw: the screw factor and the host factor. The screw factor is related to the characteristics of the screw design including diameter and length.[10] The goal is to increase initial fixation by inducing controlled compressive forces in the cortical bone layer. The host factor is cortical bone thickness which affects the initial stability of a screw.[11,12] The initial stability of miniscrews is considered essential in clinical use because of immediate or early loading in many patients.[13-17]
Knowledge of the buccal cortical bone thickness in various areas can guide clinicians in selecting the placement site and the proper placement protocol. The purpose of this in vitro study was to evaluate buccal cortical bone thickness at three interdental sites (mesial of canine, interpremolar, and intermolar) in wet sectioned mandibles of cadavers using computed tomography (CT) scans and a stereomicroscope (SM).
Materials and Methods
The sample consisted of 30 wet human cadaveric mandibles form Asian males (mean age 49.5). The mandibles were chosen from cadavers that were fixed using 10% neutral buffered formalin (approximately 4% formaldehyde) for up to 4 weeks. Gender was not a part of the selection criteria, but at the end of the total sample collection, it was observed that 30 cadavers from which the mandibles were taken were all of males. An inclusion criterion was only mandibles with full complement of teeth present. The mandibles were scanned using a commercially available CT scanner (Phillips Medical CT Unit). CT images were taken at 200-mm field of view, 120 kV, 300 m, scanning time of 0.5 s/rotation, and slice thickness of 0.5 mm with a high-resolution mode with a voxel size of 0.5 mm. After ensuring that the machine’s calibration was correct, the mandibles were positioned in the center of the scanning table in the same orientation as a live patient.
The settings were the same as those used for orthodontic diagnosis and treatment planning in the graduate orthodontic clinic at University. Raw data were collected and reconstructed using the software from the manufacturer. The reconstructed data were exported and saved as digital imaging and communications in medicine files. The radiodensity in Hounsfield units was adjusted by the operator to the threshold deemed optimal for visualization of the buccal cortical bone. Based on a preliminary skull study, the threshold window was fixed for all skulls at −280 and −510 HU at the upper and lower limits, respectively. All the measurements were made by the same operator. Each measurement was taken on the CT images on the computer display monitor using the commercially available Accuimage software. Two-dimensional slices were created at 1 mm thickness each bisecting the interradicular distance and oriented perpendicular to the bone surface [Figure 1]. Three slices in the cross-sectional view through three contact areas (between lateral incisor and canine, interpremolar, and intermolar) were created, bisecting the interradicular distance [Figure 2].

- Two-dimensional sagittal view showing the orientation of the interdental slice on which measurements were made on computed tomography scan
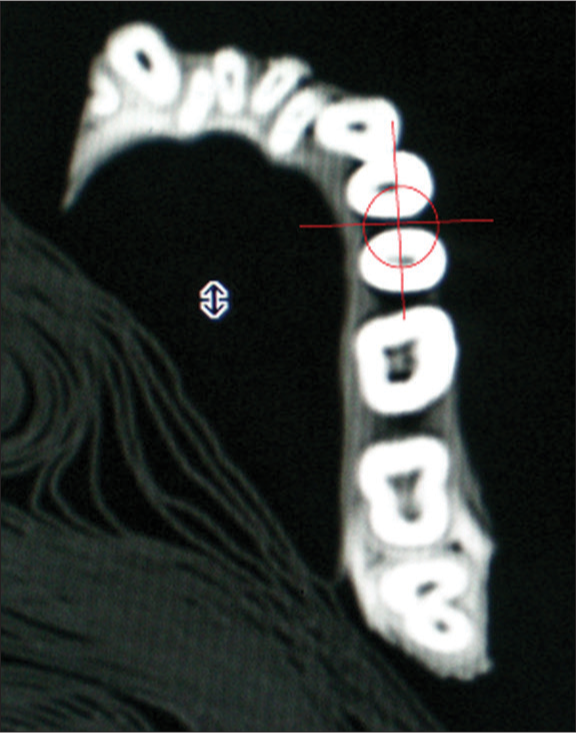
- Two-dimensional coronal view showing the orientation of the interdental slice on which measurements were made on computed tomography scan
The buccal cortical thickness was measured at nine areas on the right side of every mandibles which were named as in [Table 1].
| Location | Site name | ||
|---|---|---|---|
| At 2 mm | At 4 mm | At 6 mm | |
| MC | MC2 | MC4 | MC6 |
| IP | IP2 | IP4 | IP6 |
| IM | IM2 | IM4 | IM6 |
MC – Mesial of canine; IP – Interpremolar; IM – Intermolar
The demarcation between the cortical and cancellous bone was marked manually by visual gray-white discrimination: Grayish was cancellous bone, and white was cortical bone [Figure 3]. The cementoenamel junction (CEJ) was marked as the highest contour to occlusal surface (radio-opaque shadow) of the bone between the adjacent teeth. The linear distances were measured perpendicular to the bone surface by using the icon – “Distance” with the help of the “Ruler” (in mm) from the “Tools” menu. The intersection point of the horizontal reference line with the bone on the buccal aspect was designated at various heights from the CEJ, i.e., 2, 4, and 6 mm [Figure 4].
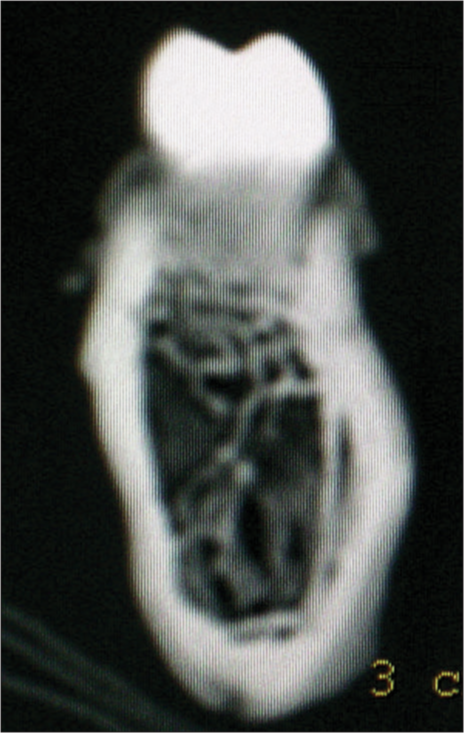
- Two-dimensional interdental slice showing tooth crown, cortical bone (white color), and cancellous bone (gray color) on computed tomography scan
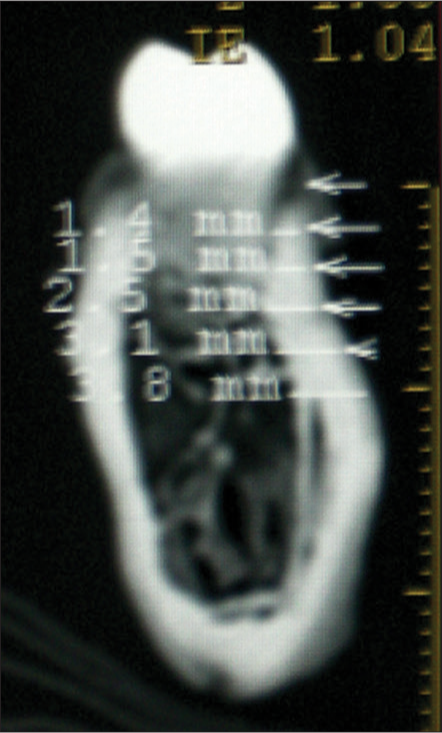
- Two-dimensional interdental slice, showing cortical (white), and trabecular (gray) bone with measurements of buccal cortical bone thickness
All the linear measurements from the CT scan images were recorded. After completion of the first method with CT scans, sections were made of the mandibles using the Modec Bone and Meat Cutter.
Vertical sections were made on the wet mandibles at three areas as follows:
The interdental area between lateral incisor and canine
The interdental area between first and second premolar
The interdental area between first and second molar.
The point of highest contour was marked on the CEJ of the section by the visual method. A vertical reference line was drawn from the highest contour of the CEJ [Figure 5]. This mandibular section was then held under a SM, and images were captured. The porous part was the cancellous bone, and the dense part was the cortical bone. SM images were calibrated, and measurements were made with Image Analysis software (Chroma Systems India). Perpendicular lines were dropped to the vertical reference line at 2, 4, and 6 mm from CEJ toward the apical region, on the images. The linear distances were measured perpendicular to the outer surface of bone with the help of the “ruler” (in mm) from the “Tools” menu in the software [Figure 6]. These linear measurements from the SM images were also recorded. After the completion of data collection, the data were subjected to statistical analysis.

- Section from the mandible

- Stereo Image - Magnification:10x
Statistical analysis
Statistical analysis was carried out using Statistical Package for Social Sciences Software (SPSS Inc. Chicago, US). Comparisons of mesial of canine, interpremolar, and intermolar measurements by CT scan and direct method were analyzed using paired t-test. The P < 0.05 was considered statistically significant. An agreement between CT scan method and SM method was assessed. SM method was considered as the gold standard.
Results
Method 1 – computed tomography scan
Statistical analysis showed that the thickness of cortical bone increased from the mesial of canines toward the premolar region and then decreased in the molar region. Increase in the thickness of cortical bone was observed with the increase in the height from the alveolar crest toward the apical region till the level of 6 mm. Maximum cortical bone thickness was found at 6 mm from the alveolar crest in the interpremolar region (2.01 ± 0.51 mm) on buccal side. Minimum cortical bone thickness is found at 2 mm from the alveolar crest in the mesial of canine region (1.49 ± 0.46 mm) on buccal side [Table 2].
| Level (mm) | Mean±SD | ||
|---|---|---|---|
| MC | IP | IM | |
| 2 mm | 1.5±0.4 | 1.7±0.5 | 1.6±0.4 |
| 4 mm | 1.7±0.4 | 1.9±0.4 | 1.7±0.4 |
| 6 mm | 1.8±0.4 | 2±0.5 | 1.8±0.5 |
MC – Mesial of canine; IP – Interpremolar; IM – Intermolar; SD – Standard deviation
Method 2 – stereomicroscope method
It was observed that the thickness of cortical bone also increased from the mesial of canines toward the premolar region and then decreased in the molar region. Increase in the thickness of cortical bone was observed with the increase in height from the alveolar crest toward the apical region till the level of 6 mm. Maximum cortical bone thickness was found at 6 mm from the alveolar crest in the interpremolar region (2.12 ± 0.55 mm) on buccal side. Minimum cortical bone thickness was found at 2 mm from the alveolar crest in the mesial of canine region (1.66 ± 0.46 mm) on buccal side [Table 3].
| Level (mm) | Mean±SD | ||
|---|---|---|---|
| MC | IP | IM | |
| 2 mm | 1.6±0.4 | 1.8±0.5 | 1.8±0.5 |
| 4 mm | 1.8±0.4 | 2.1±0.5 | 1.8±0.4 |
| 6 mm | 2.1±0.4 | 2.1±0.5 | 2±0.5 |
MC – Mesial of canine; IP – Interpremolar; IM – Intermolar; SD – Standard deviation
Comparison of both methods
The results of the t-test (P = 0.0001) showed a statistically significant difference between the two methods CT and SM at all three interdental sites (mesial of canine, interpremolar, and intermolar at 2, 4, and 6 mm) except at intermolar at 4 mm (P = 0.124) [Table 4].
| Sites | Mean±SD | P | |
|---|---|---|---|
| Pair 1 | IM2_CT | 1.6±0.4 | 0.0001* |
| IM2_SM | 1.7±0.5 | ||
| Pair 2 | IM4_CT | 1.7±0.4 | 0.148 |
| IM4_SM | 1.8±0.4 | ||
| Pair 3 | IM6_CT | 1.8±0.4 | 0.0001* |
| IM6_SM | 2.1±0.5 | ||
| Pair 4 | ip2_ct | 1.6±0.5 | 0.0001* |
| IP2_SM | 1.8±0.5 | ||
| Pair 5 | IP4_CT | 1.9±0.4 | 0.0001* |
| IP4_SM | 2±0.5 | ||
| Pair 6 | IP6_CT | 2±0.5 | 0.004* |
| IP6_SM | 2.1±0.5 | ||
| Pair 7 | MC2_CT | 1.5±0.4 | 0.0001* |
| MC2_SM | 1.6±0.4 | ||
| Pair 8 | MC4_CT | 1.6±0.4 | 0.0001* |
| MC4_4SM | 1.8±0.4 | ||
| Pair 9 | MC6_CT | 1.8±0.4 | 0.0001* |
| MC6_SM | 2±0.4 |
*P≤0.05. IM – Intermolar; IP – Interpremolar; MC – Mesial of canine; CT – Computed tomography; SM – Stereomicroscope; SD – Standard deviation
The Bland Altman plots [Figure 7] depict that the difference between the two methods SM and CT scan (SM-CT) was higher for higher averages, indicating that the SM method gives over estimated values as compared to CT.
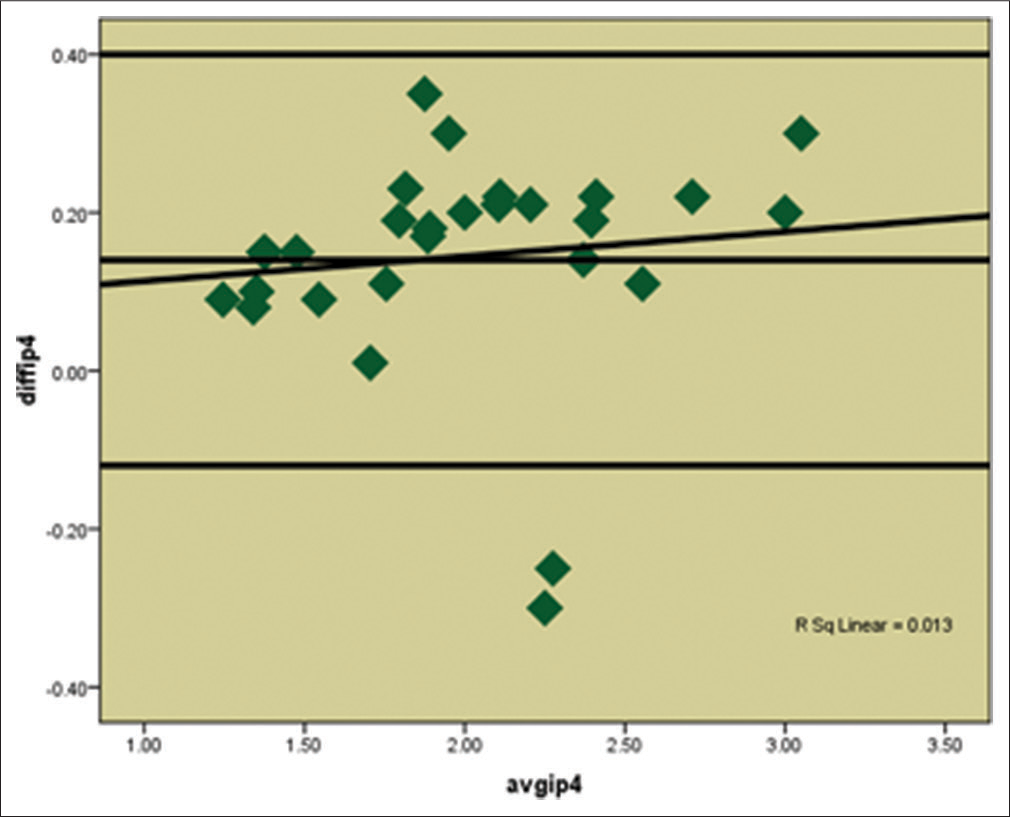
- Bland Altman Plot showing the agreement between two methods CT scan and Stereomicroscope at Interpremolar section at 4mm (IP4)
It was also observed that the mean buccal cortical bone thickness at all interdental sites at 2, 4, and 6 mm from CEJ was 1.7 ± 0.4 (P = 0.0001) by the CT scan method and 1.9 ± 0.5 (P = 0.0001) by the SM method, indicating that the results observed with the CT scan method were underestimated by 11% than the SM method [Table 5].
| Level | Mean±SD | P | |
|---|---|---|---|
| CT scan | SM | ||
| 2 mm | 1.6±0.4 | 1.7±0.5 | 0.0001* |
| 4 mm | 1.7±0.4 | 1.9±0.4 | 0.0001* |
| 6 mm | 1.9±0.4 | 2±0.5 | 0.0001* |
*P≤0.05. CT – Computed tomography; SM – Stereomicroscope; SD – Standard deviation
Discussion
All the studies so far have evaluated the cortical bone thickness of the maxilla and mandibles from dried cadaveric bones or computed tomograms. Cadaveric bones are generally macerated and dried to their decalcified forms for the purpose of preservation and study. Lindsten[18] stated that the process of maceration causes shrinkage of 0%–3.3% of the size of the bone. The wet mandibles were taken from cadavers embalmed in a buffered formaldehyde solution. However, it was observed that there was no effect on the mechanical properties of bone after storage periods of 1 year and that embalmed or frozen bones can safely be used for mechanical testing, at least for storage periods of up to 1 year.[19] Ohman et al.[20] also concluded that on a short-term perspective, embalming did not affect the compressive mechanical properties, nor hardness of human cortical bone.
In addition, CT scanners commercially available are calibrated routinely with a designated phantom with densities simulating a live person, but dry skulls do not have any soft tissue. Soft tissues have attenuation coefficients that can affect the X-ray beam going through the skull and hence the final image. The final image depends on the algorithms of the calibration process. Since the standard for calibration is for a live person, the calibration may not be optimal for the dry skulls.[21] Therefore, this study is a step ahead and the only study in orthodontic literature in which we evaluated the cortical thickness in wet mandibles from human cadavers simulating live persons.
This study was aimed to measure cortical bone thickness in 30 wet cadaveric mandibles on the buccal side with the help of two methods. Similar sample size was used by Poggio et al.[11] (CT images of 25 maxillae and mandible), Lee et al.[22] (CT images of 30 samples of maxillae and mandible), and Motoyshi et al.[23] used a higher sample (CT images of 39 maxillae and 41 mandibles) in their studies.
Most studies on this topic aimed to determine the safest sites for mini-screw placement by focusing on the posterior region of the jaws.[11,16,18] The fact, however, that mini-implants are often useful in the anterior region for space closure or correction of overbite problems necessitated the evaluation of the anterior region as well. To fulfil this objective in the present study, data on cortical bone thicknesses were provided at three sites both anteriorly and posteriorly, to provide the clinician with a comprehensive anatomic map of the mandible.
In this study, the CEJ was selected as the starting point for the measurements, unlike other studies[16,20-26] that used the alveolar crest, which could be affected by different periodontal problems. As it is advisable to place the mini-implants in areas of attached gingiva,[21] the maximum level of measurement in this study was selected to be 6 mm from CEJ. Lim et al.[25] excluded levels higher than 6 mm in their study on interradicular soft tissue for the same reason. Lim et al.[25] and Baumgaertela et al.[26] also have measured buccal cortical bone thickness at 2 mm, 4 mm, and 6 mm from the alveolar crest, whereas Lee et al.[22] investigated the inter radicular space at 2, 4, 6, and 8 mm from CEJ.
Ongoing through the observations made after statistical analysis, it was observed that by CT scan method, the thickness of cortical bone increased from the mesial of canine toward the premolar region and then decreased in the molar region. Increase in the thickness of cortical bone is observed with the increase in height from the CEJ toward the apical region till the level of 6 mm. Kim et al.[16] also concluded that mandibular cortical thickness increased from anterior to posterior region in his study. The change in the thickness was more in the posterior region than in the anterior region. Results of their study showed that maximum buccal cortical bone thickness in mandible was mesial to first molar (2.38 ± 0.47 mm). Similar results were shown by Deguchi et al.,[24] who showed the thickness to be about 2.0 ± 0.6 mm.
Motoyoshi et al.[23] stated that greater the height from the alveolar crest, thicker is the cortical bone. Studies by Baumgaertel et al.[26] concluded that the thickness of cortical bone increased with increasing distance from the alveolar crest up to 6 mm.
It was also noted that by the stereomicroscope method the thickness of cortical bone increased from the mesial of canine toward the premolar region and then decreased in the molar region. Increase in the thickness of cortical bone is observed with the increase in height from the CEJ toward the apical region till the level of 6 mm. Similar results were shown by Katranji et al.[27] who also carried out a study by directly measuring the buccal cortical bone thickness with the help of a Boley gauge in mandibular sections from cadavers stated that the average cortical thickness of the buccal plates ranged from 1.0 to 2.1 mm in the edentulous mandible, with the thinnest area in the anterior mandible and the thickest area in the posterior mandible.
Table 3 summarized that the results of the t-test (P = 0.0001) showed a statistically significant difference between the two methods CT and SM at all three sections (mesial of canine, interpremolar, and intermolar at 2, 4, and 6 mm) except at intermolar at 4 mm (P = 0.124).
Williams and Richtsmeier[28] studied the reliability of 28 skeletal mandibular landmarks and the accuracy of 378 linear distances formed by these landmarks on spiral CT images. They also concluded that the mean accuracy of all linear distances was 0.377 ± 1.136 mm with a range of 0.001–3.889 mm. The average linear measurement difference between spiral CT and gold standard was 1–2 mm. Approximately 58% of measurements were <1.0 mm by the spiral CT from the actual values. One of the reasons for underestimation with CT could be that constructed and fuzzy landmarks generally exhibit relatively more error than biological landmarks.[28]
It can be debated whether these findings are also clinically significant considering all other factors that can affect mini-implant success rates.[10] It is also well understood that shortcomings in cortical bone thickness can be compensated for by variations of mini-implant angulation or perhaps implant design (cylindrical vs. conical shank).[24] However, as Miyamoto et al.[29] demonstrated, overall cortical bone thickness is important in implant stability and therefore should be considered when selecting the preferred implant site. Therefore, in addition to the statistical significance, our findings appear to have clinical significance also.
In the present study, the Bland Altman plots showed that though the CT scan measurements were underestimated as compared to the stereomicroscopic measurements. However, it was also seen that both methods are comparable hence CT scan can be a good diagnostic tool for the evaluation of cortical bone thickness as a guide to mini-implant placement. However, when this aid is used, it must be kept in mind that measurements from CT slice data although sufficiently accurate, tend to slightly underestimate the anatomic truth. There might be slightly more bone available than the mean values indicated on the CT scan.
The limitations of the study were as follows:
Care should be taken in interpreting these results because of the relatively small number of samples; nevertheless, these results suggest an anatomical pattern to the thicknesses of cortical bone that could be useful to clinicians. Further studies using a larger sample size and a different age group are required
The cortical bone thickness in females was not evaluated. Even if this influences the absolute measured values slightly, it would probably not change the observed pattern
The variation in the mandibular cortical bone thickness is also dependent on age and likely, the forces generated during mastication and function, and ageing. Other factors that may influence the mandibular cortical thickness include facial type and gender. We hope to consider future studies that will look at these factors and evaluate the long-term changes with serial cone beam CT.
Conclusions
This study throws light on knowledge of cortical bone thickness in various areas which can guide the clinicians in selecting the implant placement site and various other biomedical procedures.
The results revealed that by both the CT scan and SM methods, buccal cortical bone thickness increases from mesial of canines toward the premolar region and then decreased in the molar region. Increase in the thickness of cortical bone is observed with the increase in height from the CEJ toward the apical region till the level of 6 mm
CT scans underestimated the measurements as compared to the SM method which was considered as the gold standard. However, it was also seen that that there was a good agreement between the two methods
The mean buccal cortical bone thickness at all interdental sites at 2 mm, 4 mm, and 6 mm from CEJ was 1.7 ± 0.4 (P = 0.0001) by the CT scan method and 1.9 ± 0.5 (P = 0.000) by the SM method, indicating that the results observed with the CT method were underestimated by 11% than the SM method.
Acknowledgment
We would like to sincerely thank the Department of Anatomy and the Department of Radiology, Bharati Vidyapeeth Medical College and Hospital, for their help in the sample collection and readings. We would also like to thank Mr. Suyog Joshi for the help with the statistical analysis.
Financial support and sponsorship
Nil.
Conflicts of interest
There are no conflicts of interest.
References
- Nonextraction treatment of an open bite with microscrew implant anchorage. Am J Orthod Dentofacial Orthop. 2006;130:391-402.
- [CrossRef] [PubMed] [Google Scholar]
- Forced eruption with microscrew anchorage for preprosthetic leveling of the gingival margin. Case report. J Orofac Orthop. 2004;65:513-9.
- [CrossRef] [PubMed] [Google Scholar]
- Esthetic segmental retraction of maxillary anterior teeth with a palatal appliance and orthodontic mini-implants. Am J Orthod Dentofacial Orthop. 2007;131:537-44.
- [Google Scholar]
- Microscrew anchorage in skeletal anterior open-bite treatment. Angle Orthod. 2007;77:47-56.
- [CrossRef] [PubMed] [Google Scholar]
- Group distal movement of teeth using microscrew implant anchorage. Angle Orthod. 2005;75:602-9.
- [Google Scholar]
- Extraction space closure with vacuum-formed splints and miniscrew anchorage. J Clin Orthod. 2005;39:76-9.
- [Google Scholar]
- Interdisciplinary treatment of Class III malocclusion using mini-implant: Problem oriented orthodontic treatment. Korean J Orthod. 2007;37:305-14.
- [Google Scholar]
- Biomechanical effect of abutment on stability of orthodontic mini-implant. A finite element analysis. Clin Oral Implants Res. 2005;16:480-5.
- [CrossRef] [PubMed] [Google Scholar]
- Factors affecting the clinical success of screw implants used as orthodontic anchorage. Am J Orthod Dentofacial Orthop. 2006;130:18-25.
- [Google Scholar]
- A radiographic evaluation of the availability of bone for placement of miniscrews. Angle Orthod. 2004;74:832-7.
- [CrossRef] [Google Scholar]
- “Safe zones”: A guide for miniscrew positioning in the maxillary and mandibular arch. Angle Orthod. 2006;76:191-7.
- [Google Scholar]
- Immediate loading of implants used for orthodontic anchorage. Clin Orthod Res. 2000;3:23-8.
- [CrossRef] [PubMed] [Google Scholar]
- Evaluation of bone thickness in the anterior hard palate relative to midsagittal orthodontic implants. Int J Oral Maxillofac Implants. 2003;18:578-81.
- [Google Scholar]
- Bone thickness of the palate for orthodontic mini-implant anchorage in adults. Am J Orthod Dentofacial Orthop. 2007;131:S74-81.
- [Google Scholar]
- Soft-tissue and cortical-bone thickness at orthodontic implant sites. Am J Orthod Dentofacial Orthop. 2006;130:177-82.
- [Google Scholar]
- Implant prosthodontic treatment options for the edentulous patient. J Oral Rehabil. 1995;22:661-71.
- [CrossRef] [PubMed] [Google Scholar]
- The effect of maceration on the dental arches and the transverse cranial dimensions: A study on the pig. Eur J Orthod. 2002;24:667-76.
- [CrossRef] [Google Scholar]
- Effect of long-term preservation on the mechanical properties of cortical bone in goats. Acta Orthop. 2008;79:708-16.
- [Google Scholar]
- The effects of embalming using a 4% formalin solution on the compressive mechanical properties of human cortical bone. Clin Biomech. 2008;23:1294-8.
- [CrossRef] [Google Scholar]
- Accuracy and reliability of cone-beam computed tomography for measuring alveolar bone height and detecting bony dehiscences and fenestrations. Am J Orthod Dentofacial Orthop. 2010;137:S109-19.
- [CrossRef] [PubMed] [Google Scholar]
- Computed tomographic analysis of tooth-bearing alveolar bone for orthodontic miniscrew placement. Am J Orthod Dentofacial Orthop. 2009;135:486-94.
- [CrossRef] [PubMed] [Google Scholar]
- Factors affecting the long-term stability of orthodontic mini-implants. Am J Orthod Dentofacial Orthop. 2010;137(588):e1-5.
- [Google Scholar]
- Quantitative evaluation of cortical bone thickness with computed tomographic scanning for orthodontic implants. Am J Orthod Dentofacial Orthop. 2006;129(721):e7-12.
- [Google Scholar]
- A descriptive tissue evaluation at maxillary interradicular sites: Implications for orthodontic mini-implant placement. Clin Anat. 2007;20:760-5.
- [CrossRef] [PubMed] [Google Scholar]
- Buccal cortical bone thickness for mini-implant placement. Am J Orthod Dentofacial Orthop. 2009;136:230-5.
- [Google Scholar]
- Cortical bone thickness in dentate and edentulous human cadavers. J Periodontol. 2007;78:874-8.
- [Google Scholar]
- Comparison of mandibular landmarks from computed tomography and 3D digitizer data. Clin Anat. 2003;16:494-500.
- [CrossRef] [PubMed] [Google Scholar]
- Influence of cortical bone thickness and implant length on implant stability at the time of surgery – Clinical, prospective, biomechanical, and imaging study. Bone. 2005;37:776-80.
- [CrossRef] [PubMed] [Google Scholar]


