

Translate this page into:
Evaluation of long-term stability of curve of Spee levelled with continuous archwires in two different retention protocol

*Corresponding author: Mansi Radia, Department of Orthodontics and Dentofacial Orthopaedics, Karnavati School of Dentistry, Gandhinagar, Gujarat, India. mansi.radia95@gmail.com
-
Received: ,
Accepted: ,
How to cite this article: Radia M, Trivedi K, Shah A, Parikh T, Panchal H. Evaluation of long-term stability of curve of Spee levelled with continuous archwires in two different retention protocol. APOS Trends Orthod 2021;11:229-34.
Abstract
Objectives:
The objectives of the study were to assess the long-term stability of the curve of Spee leveled with continuous archwire in subjects with two different retention protocols.
Materials and Methods:
The study sample consisted of 20 patients (mean age 18 ± 2 years) presenting with curve of Spee depth of =/> 3 mm. For each subject, lateral cephalograms and dental casts were available before treatment (T1), at the end of orthodontic therapy (T2), and 1 year after the end of treatment (T3). All subjects were divided into two groups according to their retention protocol – fixed retainer group (Group-1) and Essix retainer group (Group-2). Cephalometric parameters were used to evaluate the dental movements after treatment. Curve of Spee depth was measured on standardized digital images of casts.
Results:
In multicomparison table, it shows that there was a statistically significant difference (P = 0.032) between Spee-T2 and Spee-T3 and there was no statistical difference (P = 0.159) between L1MP-T2 and L1MP-T3 in fixed retainer group. In Essix retainer group, no changes were observed from L1MP-T2 to L1MP-T3 and there was a non-significant difference found between Spee-T2 and Spee-T3.
Conclusion:
In Group-1 (fixed retainer), there is some amount of relapse or extrusion of lower incisor. In Group-2 (Essix retainer), there was not any change in the position of the lower incisor, which suggests that occlusal coverage of the Essix retainer does not allow any extrusion and retains the curve of Spee.
Keywords
Curve of Spee
Stability
Retention
Fixed retainer
Essix retainer

INTRODUCTION
The anteroposterior curve or the curve of Spee was first described by F. Graf von Spee in 1890 as the anatomical curve established by the occlusal alignment of the teeth as projected onto the median plane beginning with the cusp tip of the mandibular canine and following the buccal cusp tips of the premolar and molar teeth continuing through the anterior border of the mandibular ramus and ending at the anterior aspect of the mandibular condyle. The curvature of the arc would relate, on average, to part of a circle with a 4-inch radius.[1]
Clinically, the curve of Spee is determined by the distal marginal ridges of the posterior teeth in the arch and the incisal edges of the central incisors (Hitchcock, 1983).
Typically, the curve of Spee has been measured outside of the patient’s mouth using one of two methods: Orthodontic study models and/or lateral cephalometric images.[2]
The exaggerated curve of Spee is frequently observed in dental malocclusions with deep overbites. Such excessive curve of Spee alters the muscle imbalance, ultimately leading to improper functional occlusion. It has been proposed that an imbalance between the anterior and the posterior components of occlusal force can cause the lower incisors to over-erupt, the premolars to infraerupt, and the lower molars to be inclined mesially. This altered condition requires specialized skills for the practitioner.
More recently, it was suggested that the curve of Spee has a biomechanical function during food processing by increasing the crush/shear ratio between the posterior teeth and the efficiency of occlusal forces during mastication.[3] An excessive curve of Spee is often seen in subjects with Class II malocclusions with deep overbites, and leveling of the curve with overbite reduction is hence a common treatment objective.[4]
The sixth key to normal occlusion relates to the occlusal plane. Andrews believed that a flat plane should be a treatment goal as a form of overtreatment. Reduction of the curve can be achieved by the intrusion of anterior teeth or extrusion of molars.[5]
Rozzi et al. found a significant relapse of lower incisors inclination (IMPA: −3.48°) and vertical position (L1-MP, +1.36 mm) in low angle group.[6] Koyama[7] and Garcia[8] also observed that after orthodontic treatment, the leveled curve tends to return toward its original position, often leading to undesirable relapse in overbite, mandibular incisor irregularity. Accordingly, if certain patients can be identified as high-risk candidates for overbite relapse, retention strategies might need to be altered for them to achieve the most stable outcomes.
Therefore, this study was conducted with the aim to assess the long-term stability of the curve of Spee leveled with continuous archwire in subjects with two different retention protocols.
MATERIALS AND METHODS
The samples consist of 23 patients who had undergone orthodontic treatment with a mean age of 18 ± 2 years. The sample size calculation was done using nMaster 2.0 sample size software. For all the patients, dental casts and lateral cephalograms were collected from three different intervals, that is, before treatment (T1), at the end of fixed therapy (T2), and 1 year after the end of treatment (T3).
Inclusion criteria
Each patient treated with full-fixed conventional 0.022-in slot pre-adjusted edgewise brackets (McLaughlin-Bennett-Trevisi prescription™) on all teeth
Angle’s Class II malocclusion treated with premolar extraction
Curve of Spee depth of =/>3 mm before treatment
Patients whose post-treatment retention protocol included fixed lingual retainer and Essix retainer
The curve of Spee correction with the intrusion of incisors only
FMA = 20–27°
Exclusion criteria
Periodontal disease
Any systemic disease
The data were collected from previously treated cases and patients were contacted and asked for a follow-up appointment at their convenience for post-retention records. The aim of the procedure during the follow-up appointment was explained. Out of the 23 subjects, three subjects were excluded and dropped out as they were not available for records.
The vertical position of the maxillary central incisor (U1) and maxillary first molar (U6) was measured perpendicular to the palatal plane, and mandibular central incisors (L1), mandibular first premolar (L4), and mandibular first molar (L6) were measured perpendicular to the mandibular plane. The arch leveling was measured by the changes in the measurements of the distances of L1, L4, and L6 to the mandibular plane [Table 1 and Figure 1].
| U1-PP | The perpendicular distance from maxillary incisor edge to the palatal plane. |
|---|---|
| U6-PP | The perpendicular distance from the mesiobuccal cusp of the maxillary first molar to a palatal plane. |
| L1-MP | Perpendicular distance from mandibular incisor edge to mandibular plane. |
| L4-MP | Perpendicular distance from cusp tip of mandibular first premolar to mandibular plane. |
| L6-MP | Perpendicular distance from mesiobuccal cusp of mandibular first molar to mandibular plane. |
| Mandibular plane | Formed by line through gonion and menton. |
| Palatal plane | Formed by line through ANS and PNS. |
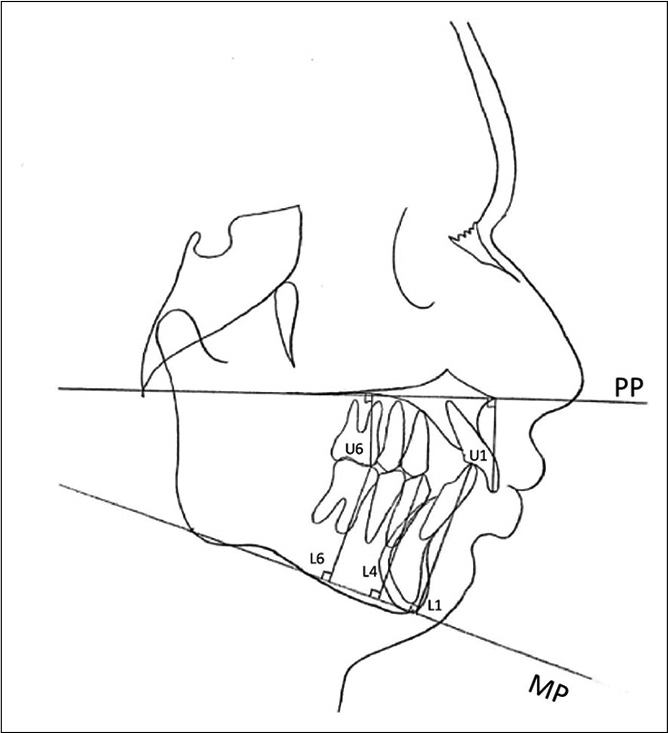
- Cephalometric landmarks.
Standardized digital photographs of the dental casts of all the subjects were taken at three different stages: Before treatment (T1), after orthodontic treatment (T2), and after post-retention period (T3). The reference scale was pre-set before measuring the curve of Spee in the ImageJ software to ensure standardization of all the images. The reference points for curve of Spee were the lines connecting the distobuccal cusps of the left and right second molars and the midpoint between the central incisors which served as the occlusal plane. The perpendicular distances from the occlusal plane were obtained on the right and left sides in the deepest point of the curve for the measurement. The curve of Spee value was calculated as a mean value of the sum of curve of Spee on the right and left sides of the dental arch [Figure 2].

- The curve of Spee measurement in the digital image of the cast with the help of ImageJ analysis software.
These 20 subjects were divided into two groups consisting of 10 samples each based on their retention protocol which was either Group 1 (fixed lingual retainer) or Group 2 (Essix retainer).
Statistical analysis
Statistical analysis was done using the Statistical Package for the Social Sciences (version 18; SPSS, Chicago, Ill). Pre-treatment (T1), post-treatment (T2), and post-retention (T3) groups were compared by repeated measurements analysis of variance. Changes between T1, T2, and T3 time points within the same group were analyzed using the Bonferroni test. The intergroup comparison was done using unpaired t-test with the significance level set at P < 0.05.
RESULTS
There was a statistically significant difference in L1MP (P = 0.001) and Spee (P = 0.000) between T1, T2, and T3 and a non-significant difference in U1PP, U6PP, and L4MP and there was no change seen in L6MP in fixed retainer group [Table 2].
| Group | N | Mean | Std. deviation | F value | P-value |
|---|---|---|---|---|---|
| U1PP-T1 | 10 | 25.20 | 2.34 | 7.160 | 0.113 NS |
| U1PP-T2 | 10 | 26.10 | 1.96 | ||
| U1PP-T3 | 10 | 26.50 | 1.90 | ||
| U6PP-T1 | 10 | 20.60 | 1.83 | 0.894 | 0.427 NS |
| U6PP-T2 | 10 | 21.20 | 2.44 | ||
| U6PP-T3 | 10 | 21.00 | 2.26 | ||
| L1MP-T1 | 10 | 38.30 | 3.40 | 11.289 | 0.001 S |
| L1MP-T2 | 10 | 36.60 | 3.20 | ||
| L1MP-T3 | 10 | 37.40 | 3.34 | ||
| L4MP-T1 | 10 | 33.10 | 3.72 | 0.114 | 0.797 NS |
| L4MP-T2 | 10 | 32.90 | 3.03 | ||
| L4MP-T3 | 10 | 33.10 | 2.96 | ||
| L6MP-T1 | 10 | 28.70 | 3.59 | - | - |
| L6MP-T2 | 10 | 28.70 | 3.59 | ||
| L6MP-T3 | 10 | 28.70 | 3.59 | ||
| Spee T1 | 10 | 7.27 | 1.39 | 33.009 | 0.000 S |
| Spee T2 | 10 | 5.20 | 0.87 | ||
| Spee T3 | 10 | 5.84 | 0.85 |
In multicomparison [Table 3], it was seen that there was a statistical difference (P = 0.032) between Spee-T2 and Spee-T3 in the fixed retainer group and there was no statistical difference (P = 0.159) seen in the value from L1MP-T2 to L1MP-T3 which might be due to error caused by manual measurement in lateral cephalogram [Table 3].
| Group | P-value | |
|---|---|---|
| U1PP-T1 | U1PP-T2 | 0.547 NS |
| U1PP-T3 | 0.269 NS | |
| U1PP-T2 | U1PP-T3 | 0.504 NS |
| U6PP-T1 | U1PP-T2 | 0.837 NS |
| U1PP-T3 | 1.000 NS | |
| U6PP-T2 | U1PP-T3 | 1.000 NS |
| L1MP-T1 | L1MP-T2 | 0.002 S |
| L1MP-T3 | 0.124 NS | |
| L1MP-T2 | L1MP-T3 | 0.159 NS |
| L4MP-T1 | L4MP-T2 | 1.000 NS |
| L4MP-T3 | 1.000 NS | |
| L4MP-T2 | L4MP-T3 | 1.000 NS |
| L6MP-T1 | L6MP-T2 | - |
| L6MP-T3 | - | |
| L6MP-T2 | L6MP-T3 | - |
| Spee T1 | Spee T2 | 0.000 S |
| Spee T3 | 0.006 S | |
| Spee T2 | Spee T3 | 0.032 S |
All parameters except L4MP showed statistically significant difference and there was no change in L6MP in Essix retainer group [Table 4].
| Group | N | Mean | Std. deviation | F value | P-value |
|---|---|---|---|---|---|
| U1PP-T1 | 10 | 26.10 | 2.55 | 3.919 | 0.039 S |
| U1PP-T2 | 10 | 25.10 | 1.91 | ||
| U1PP-T3 | 10 | 25.20 | 2.04 | ||
| U6PP-T1 | 10 | 21.60 | 1.89 | 0.849 | 0.444 S |
| U6PP-T2 | 10 | 21.10 | 2.23 | ||
| U6PP-T3 | 10 | 21.10 | 2.23 | ||
| L1MP-T1 | 10 | 38.90 | 1.66 | 121.000 | 0.000 S |
| L1MP-T2 | 10 | 36.70 | 1.82 | ||
| L1MP-T3 | 10 | 36.70 | 1.82 | ||
| L4MP-T1 | 10 | 34.10 | 2.99 | 0.400 | 0.676 NS |
| L4MP-T2 | 10 | 33.80 | 3.15 | ||
| L4MP-T3 | 10 | 33.40 | 3.30 | ||
| L6MP-T1 | 10 | 30.50 | 2.71 | - | - |
| L6MP-T2 | 10 | 30.50 | 2.71 | ||
| L6MP-T3 | 10 | 30.50 | 2.71 | ||
| Spee T1 | 10 | 7.10 | 1.74 | 21.920 | 0.001 S |
| Spee T2 | 10 | 5.19 | 1.08 | ||
| Spee T3 | 10 | 5.20 | 1.14 |
No changes were observed from L1MP-T2 to L1MP-T3 and there was a non-significant difference (P = 1.000) found between Spee2-Spee3 in the Essix retainer group [Table 5].
| Group | P-value | |
|---|---|---|
| U1PP-T1 | U1PP-T2 | 0.221 NS |
| U1PP-T3 | 0.243 NS | |
| U1PP-T2 | U1PP-T3 | 1.000 NS |
| U6PP-T1 | U1PP-T2 | 1.000 NS |
| U1PP-T3 | 1.000 NS | |
| U6PP-T2 | U1PP-T3 | - |
| L1MP-T1 | L1MP-T2 | 0.000 S |
| L1MP-T3 | 0.000 S | |
| L1MP-T2 | L1MP-T3 | - |
| L4MP-T1 | L4MP-T2 | 1.000 NS |
| L4MP-T3 | 1.000 NS | |
| L4MP-T2 | L4MP-T3 | 0.504 NS |
| L6MP-T1 | L6MP-T2 | - |
| L6MP-T3 | - | |
| L6MP-T2 | L6MP-T3 | - |
| Spee T1 | Spee T2 | 0.003 S |
| Spee T3 | 0.003 S | |
| Spee T2 | Spee T3 | 1.000 NS |
Unpaired t-test carried out for comparison between two group shows that there was no statistically significant difference found between the two groups [Tables 6 and 7].
| Group | N | Mean | Std. deviation | t value | P-value |
|---|---|---|---|---|---|
| U1PP-T2 | |||||
| Fixed retainer | 10 | 26.10 | 1.969 | 1.152 | 0.264 |
| Essix retainer | 10 | 25.10 | 1.912 | ||
| U6PP-T2 | |||||
| Fixed retainer | 10 | 21.20 | 2.440 | 0.096 | 0.925 |
| Essix retainer | 10 | 21.10 | 2.234 | ||
| L1MP-T2 | |||||
| Fixed retainer | 10 | 36.60 | 3.204 | −0.086 | 0.933 |
| Essix retainer | 10 | 36.70 | 1.829 | ||
| L4MP-T2 | |||||
| Fixed retainer | 10 | 32.90 | 3.035 | −0.650 | 0.524 |
| Essix retainer | 10 | 33.80 | 3.155 | ||
| L6MP-T2 | |||||
| Fixed retainer | 10 | 28.70 | 3.592 | −1.264 | 0.222 |
| Essix retainer | 10 | 30.50 | 2.718 | ||
| Spee-T2 | |||||
| Fixed retainer | 10 | 5.20 | 0.879 | 0.035 | 0.973 |
| Essix retainer | 10 | 5.19 | 1.085 |
| Groups | N | Mean | Std. deviation | t value | P-value |
|---|---|---|---|---|---|
| U1PP-T3 | |||||
| Fixed retainer | 10 | 26.50 | 1.900 | 1.473 | 0.158 |
| Essix retainer | 10 | 25.20 | 2.044 | ||
| U6PP-T3 | |||||
| Fixed retainer | 10 | 21.00 | 2.261 | −1.000 | 0.922 |
| Essix retainer | 10 | 21.10 | 2.234 | ||
| L1MP-T3 | |||||
| Fixed retainer | 10 | 37.40 | 3.340 | 0.581 | 0.568 |
| Essix retainer | 10 | 36.70 | 1.829 | ||
| L4MP-T3 | |||||
| Fixed retainer | 10 | 33.10 | 2.961 | −0.214 | 0.833 |
| Essix retainer | 10 | 33.40 | 3.307 | ||
| L6MP-T3 | |||||
| Fixed retainer | 10 | 28.70 | 3.592 | −1.264 | 0.222 |
| Essix retainer | 10 | 30.50 | 2.718 | ||
| Spee-T3 | |||||
| Fixed retainer | 10 | 5.84 | 0.850 | 1.416 | 0.174 |
| Essix retainer | 10 | 5.20 | 1.147 |
DISCUSSION
There is a natural tendency for the curve of Spee to deepen with time as the lower jaw grows downward, forward, and continues to do so for a longer duration than that of the upper jaw. This results in the lower anterior teeth, which are usually confined by the upper anterior teeth and lips, being forced back and up, resulting in crowded lower anterior teeth and/or a deeper overbite and deeper curve of Spee. At the distal end of the lower molars, the third molars push forwards, even after growth has stopped, creating essentially the same results.
Andrews, while describing the six characteristics of normal occlusion, mentioned that the curve of Spee in subjects with good occlusion ranged from flat to mild, noting that the best static intercuspation occurred when the occlusal plane was relatively flat. He proposed that flattening the occlusal plane should be a treatment goal in orthodontics. This concept, especially as applied to deep overbite patients, has been supported by others and produces variable results about maintaining a level curve after treatment.[5]
A curve of Spee in harmony with the condylar guidance, incisal guidance, plane of occlusion, and prosthetic tooth cusp height is essential for developing a bilaterally balanced articulation which is believed to maintain optimal occlusal stability.[9]
The stability of leveling curve of Spee may be dependent on the specific nature of its correction. In addition, variables such as the amount of growth and the patient’s age during treatment, muscle strength, neuromuscular adaptation, and the original malocclusion all have been postulated as factors contributing to the long-term stability of correction of the curve of Spee.[10]
Lie et al.[11] investigated the post-treatment development of the curve of Spee and its post-treatment stability based on cephalometric parameters and concluded that the depth of the mandibular curve of Spee and the location of its deepest point after orthodontic treatment are frequently unstable and unexpected changes are relatively common. It was also reported by Razdolsky et al.[12] that relative vertical movements can continue up to 21 months after completion of the orthodontic therapy. Therefore, it is of the utmost importance to retain the curve of Spee after the completion of the treatment. More stability might be expected after a relatively large leveling of deep curves during treatment. However, relapse of the curve of Spee is usually associated with the deepening of the bite post-retention.
The aim of this study was to evaluate the long-term stability of curve of Spee depth in patients with two different retention protocols 1 year after the end of treatment with fixed appliances and continuous archwires. The findings suggest that there is a statistically non-significant difference in the value of U1PP from T2 to T3 in both the groups which is not in agreement with the study done by De Praeter[13] et al. He concluded that the deepening of the bite is caused by the extrusion of the maxillary anterior dentition instead of the lower anteriors.
In Group-1 (fixed retainer), there is a statistically significant difference in the value of curve of Spee from T2 to T3, which suggest that there is some amount of relapse or extrusion of lower incisor. Our results are in agreement with the study by Varlik et al.[14] who found that that in post-retention, there was 0.8 mm extrusion of mandibular incisor and Rozzi et al.,[5] in which there was 1.36 mm of extrusion of mandibular incisor.
In Group-2 (Essix retainer), there was no difference in the value of L1-MP and Spee from T2 to T3, which is comparable to the findings with Dinçer and Aslan.[15] They concluded that the expected increase of occlusal contacts was not observed at the end of the retention period with Essix thermoplastic retainers as these cover the occlusal surfaces of teeth. It was also concluded by Jäderberg[16] et al.; that the Essix retainer is sufficient for maintaining the results after orthodontic treatment and the night-time wear is adequate.
CONCLUSION
In Group-1 (fixed retainer), there is a statistically significant difference in the value of the curve of Spee from T2 to T3, which suggest that there is some amount of relapse or extrusion of lower incisor.
In Group-2 (Essix retainer), there was no statistical difference in the value of the curve of Spee and there was no change in the value of L1MP from T2 to T3 in Group-2, which suggests that occlusal coverage of the Essix retainer does not allow any extrusion and retains the curve of Spee.
Declaration of patient consent
Patient’s consent not required as patients identity is not disclosed or compromised.
Financial support and sponsorship
Nil.
Conflicts of interest
There are no conflicts of interest.
References
- The curve of Spee revisited. Am J Orthod Dentofacial Orthop. 1996;110:206-10.
- [CrossRef] [Google Scholar]
- Relationship between the mandibular condyle and the occlusal plane during hominid evolution: Some of its effects on jaw mechanics. Am J Phys Anthropol. 1987;73:193-207.
- [CrossRef] [PubMed] [Google Scholar]
- Significance of curve of spee: An orthodontic review. J Pharm Bioallied Sci. 2012;4(Suppl 2):S323-8.
- [CrossRef] [PubMed] [Google Scholar]
- Long-term stability of curve of Spee levelled with continuous archwires in subjects with different vertical patterns: A retrospective study. Eur J Orthod. 2019;41:286-93.
- [CrossRef] [PubMed] [Google Scholar]
- A comparative analysis of the curve of Spee (lateral aspect) before and after orthodontic treatment-with particular reference to overbite patients. J Nihon Univ Sch Dent. 1979;21:25-34.
- [CrossRef] [PubMed] [Google Scholar]
- Leveling the curve of Spee: A new prediction formula. J Charles H Tweed Int Found. 1985;13:65-72.
- [Google Scholar]
- Management of Temporomandibular Disorders and Occlusion (5th ed). St Louis: Mosby; 2003. p. :67-197.
- [Google Scholar]
- Stability of deep overbite correction. Eur J Orthod. 1983;5:75-83.
- [CrossRef] [PubMed] [Google Scholar]
- Post-treatment development of the curve of Spee. Eur J Orthod. 2006;28:262-8.
- [CrossRef] [PubMed] [Google Scholar]
- Occlusal contacts following orthodontic treatment: A follow-up study. Angle Orthod. 1989;59:181-6.
- [Google Scholar]
- Long-term stability of the leveling of the curve of Spee. Am J Orthod Dentofacial Orthop. 2002;121:266-72.
- [CrossRef] [PubMed] [Google Scholar]
- Deepbite correction with incisor intrusion in adults: A long-term cephalometric study. Am J Orthod Dentofacial Orthop. 2013;144:414-9.
- [CrossRef] [PubMed] [Google Scholar]
- Effects of thermoplastic retainers on occlusal contacts. Eur J Orthod. 2010;32:6-10.
- [CrossRef] [PubMed] [Google Scholar]
- Removable thermoplastic appliances as orthodontic retainers-a prospective study of different wear regimens. Eur J Orthod. 2012;34:475-9.
- [CrossRef] [PubMed] [Google Scholar]


