

Translate this page into:
Measuring molar movement: A reliable technique
This article was originally published by Wolters Kluwer and was migrated to Scientific Scholar after the change of Publisher.
Abstract
A technique of accurately assessing left and right maxillary molar movement is described, using superimposition of digital study models. This method has distinct advantages over the traditional method of measuring tooth movement using cephalometric radiographs.
Keywords
Digital models
molar movement
3-D superimposition

INTRODUCTION
Cephalometric superimposition has been the method used to assess tooth movement in orthodontics for the last 80 years. Inherent problems involve patient’s exposure to potentially harmful radiation as well as all the problems accompanying converting a three-dimensional (3D) object to a two-dimensional (2D) representation, including blurred and overlapping landmarks and structures.
Accurate superimposition of study casts has been suggested by many workers as an alternative. Early workers investigated the anatomy and stability of palatal rugae, and it was noted that while some interrugae distances were constant, particularly those close to the midline, the movement of teeth could affect their position.[1,2] Specific areas of the palatal rugae have been suggested as stable points against which the movement of molar teeth could be measured.[3] Tooth position measured relative to the lateral ends of the rugae was affected by headgear treatment[4] and also by maxillary premolar extraction.[5] The latter two groups of authors, however, also conceded that the medial part of the palatal rugae was sufficiently stable to allow reliable superimposition of maxillary models from which accurate measurements could be taken and valid conclusions could be drawn. This conclusion is supported by work comparing tooth movement detected by model analysis, with that measured on lateral cephalometric radiographs.[6] These authors found no significant differences between tooth movements measured cephalometrically and those measured from the medial and lateral ends of the first and second rugae and the lateral end of the third rugae.
Thiruvenkatachari et al. conducted a study to test the precision of the 3D scanner and to compare it with measurements from cephalometric radiographs.[7] They developed a method of superimposing scans from pre- and post-treatment models using primarily stable points on the palatal rugae and also a stable area in the center of the hard palate. They highlighted the medial end of the third rugae and the palatal vault as the most stable points from which tooth movement can be measured.
In the past, several studies have assessed tooth movement using the laser scanner, but none of the studies have explained clearly the method of measuring 3D tooth movements and a reliability assessment for the method used. Hence, the aim of this study is to explain the method used to accurately measure 3D tooth movements and also to evaluate the reliability of the method.
Method of assessing three-dimension tooth movements
The movements of particular interest in this study were those of the molar teeth. The 3D scans of the study models were taken to allow very accurate measurement of the molar movement in all three planes of space. The 3D images were analyzed using Rapidform 2006 software (INUS Technology and Rapidform Inc., Seoul, Korea).
The scans are made up of approximately 300,000 points which form a 3D polygon mesh [Figure 1]. To enable differentiation between the start and finish models, we colored the start models (Ms) yellow and the “finish” models (Mf) red. This convention was adhered to throughout the study.
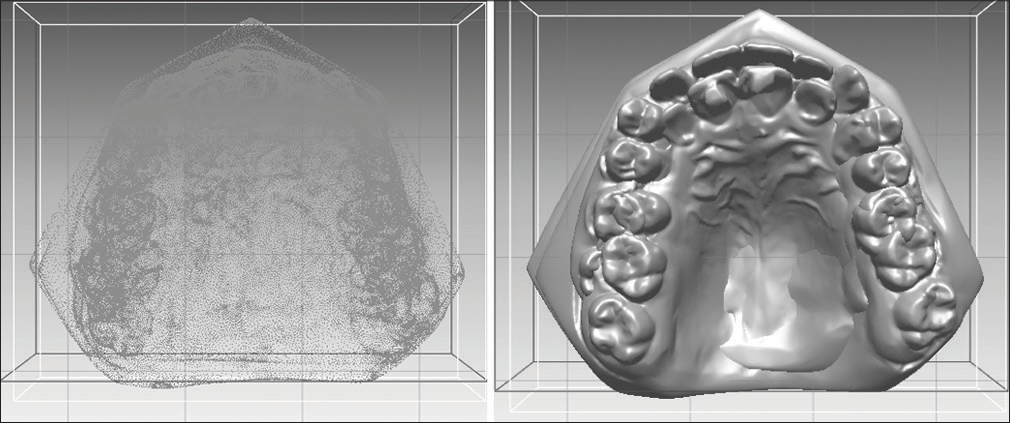
- Three-dimension polygon mesh reorientated to occlusal view then converted to solid color
Initial superimposition of Ms and Mf was carried out on areas common to both models, which have previously been shown to have good stability. A split screen was used to allow precise visualization of the anatomical detail of the palate on both models.
The same anatomical landmarks were now alternately selected between Ms and Mf to represent identical anatomical points. Ideally, points on at least three of the major rugae are identified on each side of the midline and selected at their mesial and distal extremities. The points are indicated on the computer screen by identical colored dots on both Ms and Mf [Figure 2]. Once the relevant anatomical points are all highlighted, the program was instructed to carry out an initial superimposition based on those anatomical points. The precision of the superimposition is then represented by a histogram; the colors of the models indicate the magnitude of discrepancy [Figure 3]. Blue coloration indicates a perfect fit, through cyan and green indicating an acceptable level of discrepancy. Larger discrepancies are highlighted in the yellow, orange, and red end of the spectrum.
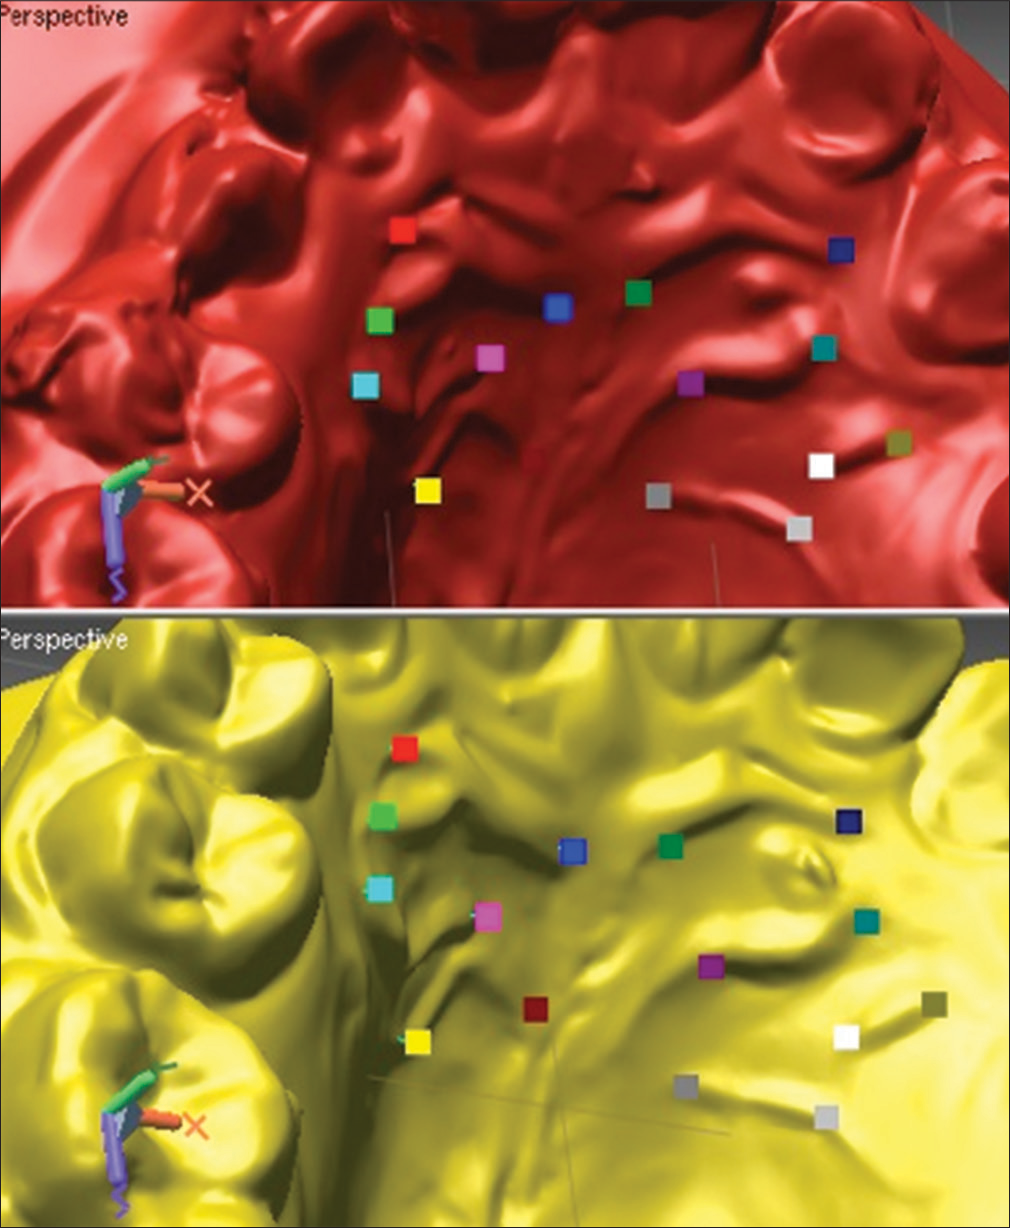
- Split screen allows simultaneous viewing of yellow pretreatment and crimson posttreatment scans

- Color indicates precision of superimposition, average figure was also calculated
Once the initial superimposition, purely on the mesial and distal rugal points, is within an acceptable level of accuracy, a more detailed “regional superimposition” is carried out. An area of known stability of the palate was described in a previous study.[7] This involves highlighting a “mushroom-shaped” area of soft tissue over the palatal rugae, plus the “mushroom stalk” extending for a few millimeters on either side of the midline palatal raphe [Figure 4]. The computer software then superimposes the two models using this whole “area of stability” and subsequently calculates the precision of superimposition. The histogram and the colors of the models indicate the degree of deviation from a “perfect fit.” When the average discrepancy is <0.8 mm, the superimposition can be again considered acceptable. The rugae areas should show blue color (no discrepancy) denoting that the superimposition is excellent. If the overall superimpositions reveal an average discrepancy of >0.8 mm, the whole process is repeated until an average level of <0.8 mm is reached.
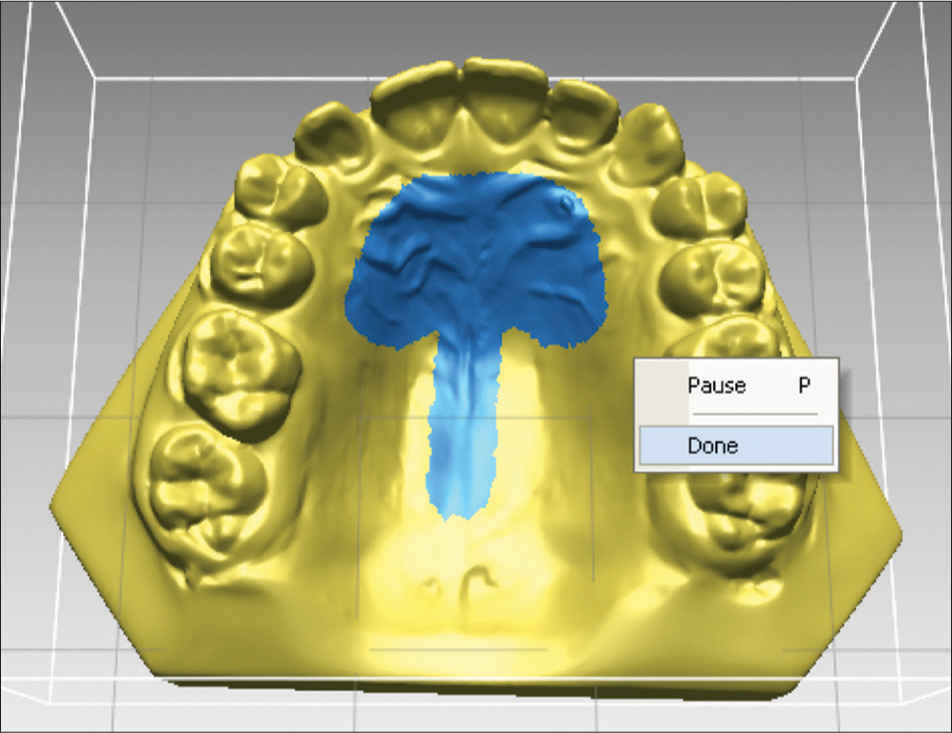
- Mushroom-shaped area outlined for more detailed superimposition
Identifying molar movements
The next stage in the process is to identify and highlight the “shell” of the left and right molar teeth, whose movement is to be measured. The crowns of the selected molars are highlighted in blue, first the occlusal surface is selected then, after tilting the model to reveal the buccal then the palatal surface, the entire “shell” of the crown is selected [Figure 5]. This shell can then be copied, named (e.g., UL6s), and saved as a freestanding shell. The process was then repeated for the other side of the arch on Ms and then once again repeated for both molar crowns on Mf.

- Model rotated to allow molar shell to be highlighted
This shell of the upper left first molar on Ms is then superimposed exactly on the occlusal surface of the shell of the upper left first molar on Mf, using the fine superimposition function within the program. The original buccal and palatal surface outlines from the molar shell at the start of treatment are the ones used on the final molar shell to get rid of any gingival effects on the posttreatment model (e.g., gingival irritation, overgrowth, or hyperplasia), which would affect the determination of the center of mass (CoM) of the crown. The computer program calculates CoM of both upper first molar shell on the pretreatment original and also of the “adjusted” upper first molar shell on the posttreatment model. Identifying CoM is critical as this will pick up the only bodily movement of teeth and not tipping movements. Previous authors have used a reference point on the occlusal surface of molars to calculate molar movement posttreatment. However, this measurement does not differentiate between tipping and bodily movement.
The next step is to calculate the difference between the CoM from Ms and Mf and to reveal the molar movement during orthodontic treatment in a simple form [Figure 6]. The X-axis represents movement in a buccopalatal direction, the Y-axis, movement in a vertical direction, and the Z-axis is an indication of mesiodistal movement of the molar tooth. Depending on the order of superimposition of the models, the positive or negative notation of the measured movement could vary. Therefore, the convention was to superimpose the posttreatment model on the pretreatment model to ensure consistency.
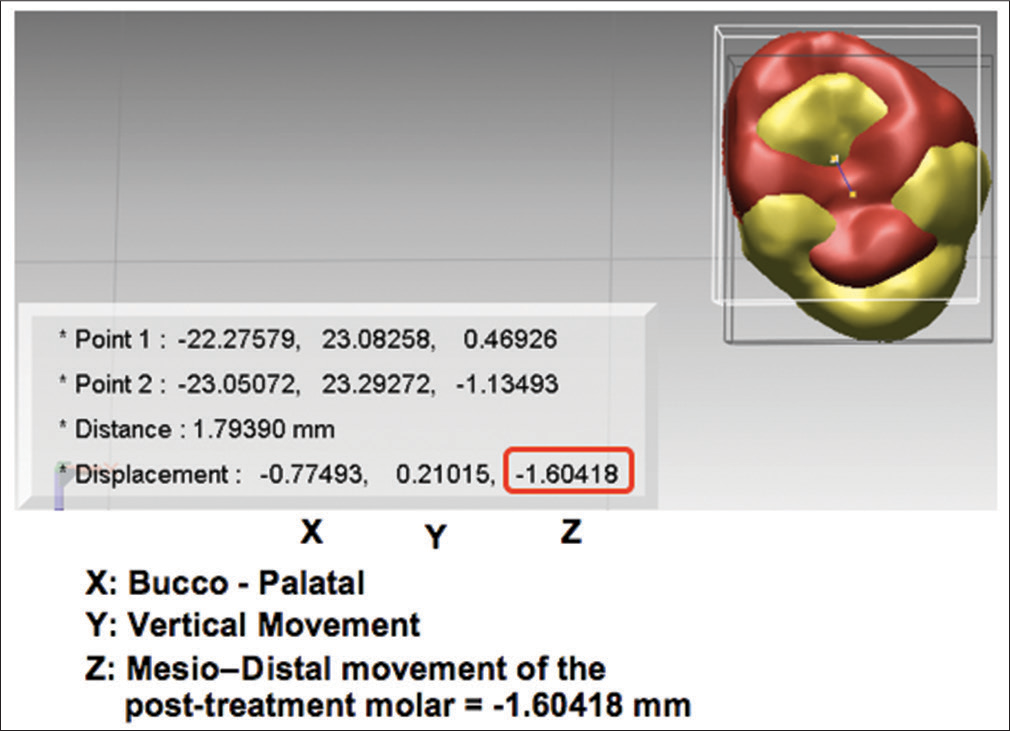
- Centers of mass of molar crowns was identified and movement was calculated in three-dimension
Reproducibility of this technique
To carry out the reproducibility study of the above technique, twenty sets of pre- and post-treatment study models were randomly selected from cases included in a randomized clinical trial comparing methods of anchorage reinforcement.
The study models were randomly selected (internet based random sequence) and anonymized by an independent person (not related to the study), and each patient was given a number. The investigation was aimed at identifying any differences in the detected movement of the CoM of the molar teeth between successive superimpositions of the randomly chosen set of twenty pairs of scans, on two separate occasions at least 2 weeks apart. The study models were rerandomized in a different order by the same independent person and the same set of measurements were carried out 2 weeks later.
Molar movement was calculated in all the three planes of space for both right and left molars using the above technique. Data were stored both as a Rapidform file to give visual presentation of the molar movement and to show the figures for crosschecking for accurate data entry [Figure 7] and as an excel file which could be imported into SPSS 19 (Chicago, Illinois: SPSS Inc. ISBN 1-56827-390-8.) for Mac.

- Rapidform file allows visualization of the molar movement
Analysis
The random code was broken for analysis by the statistician who was not involved in the study. Data for the differences between the first and second superimpositions for each set of movements for both molar teeth, i.e., in the x, y, and z planes were examined. This was found to be distributed normally; hence, parametric statistical tests were employed for further analysis. Intraclass correlation coefficient was used with one-way random option to investigate the relationship between the two determinations. Clearly, the linearity between the two determinations can be seen, and therefore, it was appropriate to calculate the correlation coefficient.
RESULTS
Intraclass correlation coefficients for the continuous data varied between 0.856 and 0.987 indicating a very strong correlation between the repeated measurements.
A two-tailed t-test was then used to establish if the correlation coefficient was statistically significantly different from zero, thus confirming if there was an association between the two measurements. The correlation coefficient is significantly different from zero (P < 0.001).
Limits of agreement
Bland–Altman plots were also carried out for the pairs of determinations to look for random error or bias.
The Bland–Altman analysis showed that the double determinations of the molar movements, following repeated superimposition, consistently provided similar measurements. An example of the Bland–Altman plots can be seen for the double determinations of the superimpositions [Figure 8].

- Bland–Altman plot of double determinations
Error of method
A paired sample t-test was conducted to compare the means of the measurements on the first and second occasion. Means, standard deviations, and standard errors of the mean can be seen in Table 1. None of the measurements showed statistically significant differences on each of the six variables (P > 0.05).
| Tooth and direction of movement | Mean of the difference | Std Dev. | Std. Error Mean | Lower 95% CI | Upper 95% CI | P |
|---|---|---|---|---|---|---|
| U R molar transverse (X) | −0.0009 | 0.152 | 0.034 | −0.072 | 0.07 | 0.979 |
| U R molar vertical (Y) | 0.011 | 0.292 | 0.065 | −0.125 | 0.148 | 0.863 |
| U R molar antero-posterior (Z) | −0.127 | 0.337 | 0.075 | −0.285 | 0.030 | 0.107 |
| U L molar transverse (X) | 0.048 | 0.120 | 0.027 | −0.008 | 0.105 | 0.088 |
| U L molar vertical (Y) | 0.032 | 0.307 | 0.069 | −0.112 | 0.176 | 0.647 |
| U L molar antero-posterior (Z) | −0.021 | 0.619 | 0.139 | −0.311 | 0.269 | 0.882 |
DISCUSSION
Cephalometric superimposition is the accepted method of assessing molar tooth movement between two-time points; however, this technique has many inherent disadvantages. First, it puts our patients at risk using potentially harmful radiation and unnecessary patient exposure is becoming more and more unacceptable.[8] Second, errors in identification of radiographic landmarks compounded by additional errors when making linear and angular measurements are well documented.[9,10] While every effort can be made to minimize these errors, they will never be eliminated completely. Third, a tracing taken from lateral cephalograms and subsequently superimposed will only ever be a (2D) representation of 3D movements. Bilateral landmarks are subject to differing magnifications and their outlines are often “averaged” or approximated to represent a “mean molar” tooth. By the time the magnifications and the averaging on the start and finish radiographs are all thrown into the melting pot, one has to wonder how much of the true molar tooth movement is really represented on these imprecise sketchings. Over 50 years ago it was suggested, that to reduce errors in landmark identification, all the radiographs of a particular patient should be viewed side-by-side, and the landmarks decided on and marked with “pin pricks through the emulsion” on the actual films.[11] The digital equivalent of this “side-by-side” viewing method was carried out in the model’s section of the study, where the palatal rugae of Ms and Mf was identified and duly marked [Figure 5].
Modern laser technology has allowed very accurate 3D scans of models to become a reality. Investigations have been carried out to check the precision of these digital study models and measurements taken on these have been shown to comparable to those taken on conventional study models.[12,13] To increase the reliability of the method even further, we decided to take silicone impressions. Although all impressions were cast on site in the respective hospital laboratories, there was always the potential for a delay in processing of the models. Alginate impressions are known to shrink slightly if there is undue delay and silicone impression material is known to be a more accurate and dimensionally stable material.
A sample size calculation showed that when the sample size is 20, a two-sided 95.0% confidence interval computed using the large sample normal approximation for an intraclass correlation based on two measurements will extend about 0.085 from the observed intraclass correlation when the expected intraclass correlation is 0.900. Twenty sets of models represented just over 25% of the total number of cases in the study and it was felt that any random errors identified within this sample would be representative of random errors present in the whole study group. This error study aimed to demonstrate a reliable technique of superimposing 3D scans of models, at two-time points in treatment, ultimately to see if tooth movements can be accurately measured in three planes of space. If reliable and reproducible, this method would ultimately offer a number of advantages over the conventional way of measuring tooth movement. One major advantage would be avoiding radiation which would mean that multiple assessments could be made as often as was thought to be necessary and to allow maximum information to be gained about the nature of tooth movement. Another major advantage is the ability to separate movements of the left from the right molar thus allowing a far greater understanding of how the mechanical systems we use affect the position of the teeth.
The use of the intraclass correlation coefficient confirmed the strong correlation between all the repeated measurements and the Bland–Altman plots indicated little or no random error or bias within the method of measurement. Paired sample t-tests confirmed no significant differences between the repeated measurements.
CONCLUSIONS
The method described for superimposition of repeated digital models is reliable and reproducible. This could be considered for use alongside cephalometric measures in all future biomechanical orthodontic studies investigating the nature, efficiency, and effectiveness of tooth moving systems.
Financial support and sponsorship
Nil.
Conflicts of interest
There are no conflicts of interest.
References
- The effects of tooth movement on the palatine rugae. J Prosthet Dent. 1967;18:536-42.
- [CrossRef] [Google Scholar]
- Changes in the position of the posterior teeth in relation to the ruga points. Am J Orthod Dentofacial Orthop. 1978;74:142-61.
- [Google Scholar]
- Stability of the palatal rugae as landmarks for analysis of dental casts. Angle Orthod. 1995;65:43-8.
- [Google Scholar]
- Stability of the palatal rugae as landmarks for analysis of dental casts in extraction and nonextraction cases. Angle Orthod. 1996;66:73-8.
- [Google Scholar]
- The use of palatal rugae for the assessment of anteroposterior tooth movements. Am J Orthod Dentofacial Orthop. 2001;119:482-8.
- [Google Scholar]
- Measuring 3-dimensional tooth movement with a 3-dimensional surface laser scanner. Am J Orthod Dentofacial Orthop. 2009;135:480-5.
- [Google Scholar]
- Orthodontic Radiographs – Guidelines for the Use of Radiographs in Clinical Orthodontics (3rd ed). London: British Orthodontic Society; 2008.
- The reliability of head film measurements. 1. Landmark identification. Am J Orthod Dentofacial Orthop. 1971;60:111-27.
- [Google Scholar]
- The reliability of head film measurements 2. Conventional angular and linear measures. Am J Orthod Dentofacial Orthop. 1971;60:505-17.
- [CrossRef] [Google Scholar]
- Cephalometrics and longitudinal research. Am J Orthod Dentofacial Orthop. 1960;46:36-42.
- [CrossRef] [Google Scholar]
- Validity, reliability, and reproducibility of plaster vs. digital study models: Comparison of peer assessment rating and Bolton analysis and their constituent measurements. Am J Orthod Dentofacial Orthop. 2006;129:794-803.
- [CrossRef] [PubMed] [Google Scholar]
- Assessing the American Board of Orthodontics objective grading system: Digital vs. plaster dental casts. Am J Orthod Dentofacial Orthop. 2007;131:51-6.
- [CrossRef] [PubMed] [Google Scholar]


